Izu Climbing

Introducing cycling routes on the Izu Peninsula, Japan

  • A Cyclocomputer Error Couldn’t Stop the Ride: Taikanzan to Myojin and Mikuni Passes

    I wondered how far these riders were going today.

    It was shortly after 8 a.m.

    I was riding the coastal road toward Manazuru, watching the Audax Japan reflectors on the saddle bags of the road cyclists ahead of me.

    With saddle bags, top-tube bags, and reflective vests, they were immediately recognizable as brevet riders. Multiple front and rear lights suggested that they would be riding a very long distance, including through the night.

    My route for the day was the Myojin and Mikuni Pass loop, which has become one of my standard rides from home. I have ridden several variations of this loop before.

    Mount Fuji Shining in the Sun: Ashigara Pass to Myojin and Mikuni Passes (JP only)

    A Summerlike Spring Day with Mount Fuji: Ashigara, Myojin, Mikuni, and Doshi Passes (JP only)

    I usually approach the climb from Oyama after crossing Ashigara Pass from the Matsuda side. This time, I changed the route considerably and decided to approach from Upper Gotemba after climbing Taikanzan from Yugawara.

    I had not climbed Taikanzan recently, and perhaps I thought it would be a shame to go all that way and simply return afterward. I can no longer say for certain.

    In any case, I considered my route of 250 km with 3,500 m of elevation gain to be substantial. The brevet riders passed me and continued south on Route 135 toward Atami. I watched them go, wondering whether they were riding 500 km. Later, I discovered that it was apparently a 600 km event starting in Kanagawa, passing through central Izu, reaching Suwa, and returning. Incredible.

    Yugawara Station was quiet in the morning. Although it is a hot-spring town, it feels considerably calmer than Atami, and I think it is a lovely place. There is plenty of good food too. Yugawara’s local tantan yakisoba seems to divide opinion, but I like it.

    Yugawara’s Famous Tantan Yakisoba: Slightly Spicy and Addictive (JP only)

    I have visited two restaurants serving it, and the dish seems to vary considerably from place to place. I briefly considered turning around after Taikanzan and trying another restaurant.

    There is also a brewery near the harbor, roughly between Yugawara and Manazuru.

    HUMANSBEER | Craft Beer Brewery (JP only)

    Craft beer on their rooftop terrace is excellent.

    Of course, that does not work when traveling by bicycle. It made me imagine a bicycle chauffeur service. The rider who has been drinking walks home. Of the two staff members, one rides the customer’s bicycle while the other follows on a tandem. On the return trip, both staff members ride the tandem together. The scene would be rather entertaining.

    Are tandems even allowed on public roads here?

    But I digress.

    Taikanzan begins after a gentle climb through Yugawara’s hot-spring district. The Strava segment starts in front of Manyo Park, a park with a walking path along a ravine. From there, it is a long climb of about 16 km.

    In terms of volume, it is similar to last week’s climb to Yanagisawa Pass from Tabayama Village. There are no extremely steep sections. The climb is mostly steady, with some almost-flat sections and gradients up to around 9% that test the legs just enough.

    I am not particularly good at long climbs. Stronger climbers can finish it much more quickly, so whether it counts as a long climb probably depends on the rider.

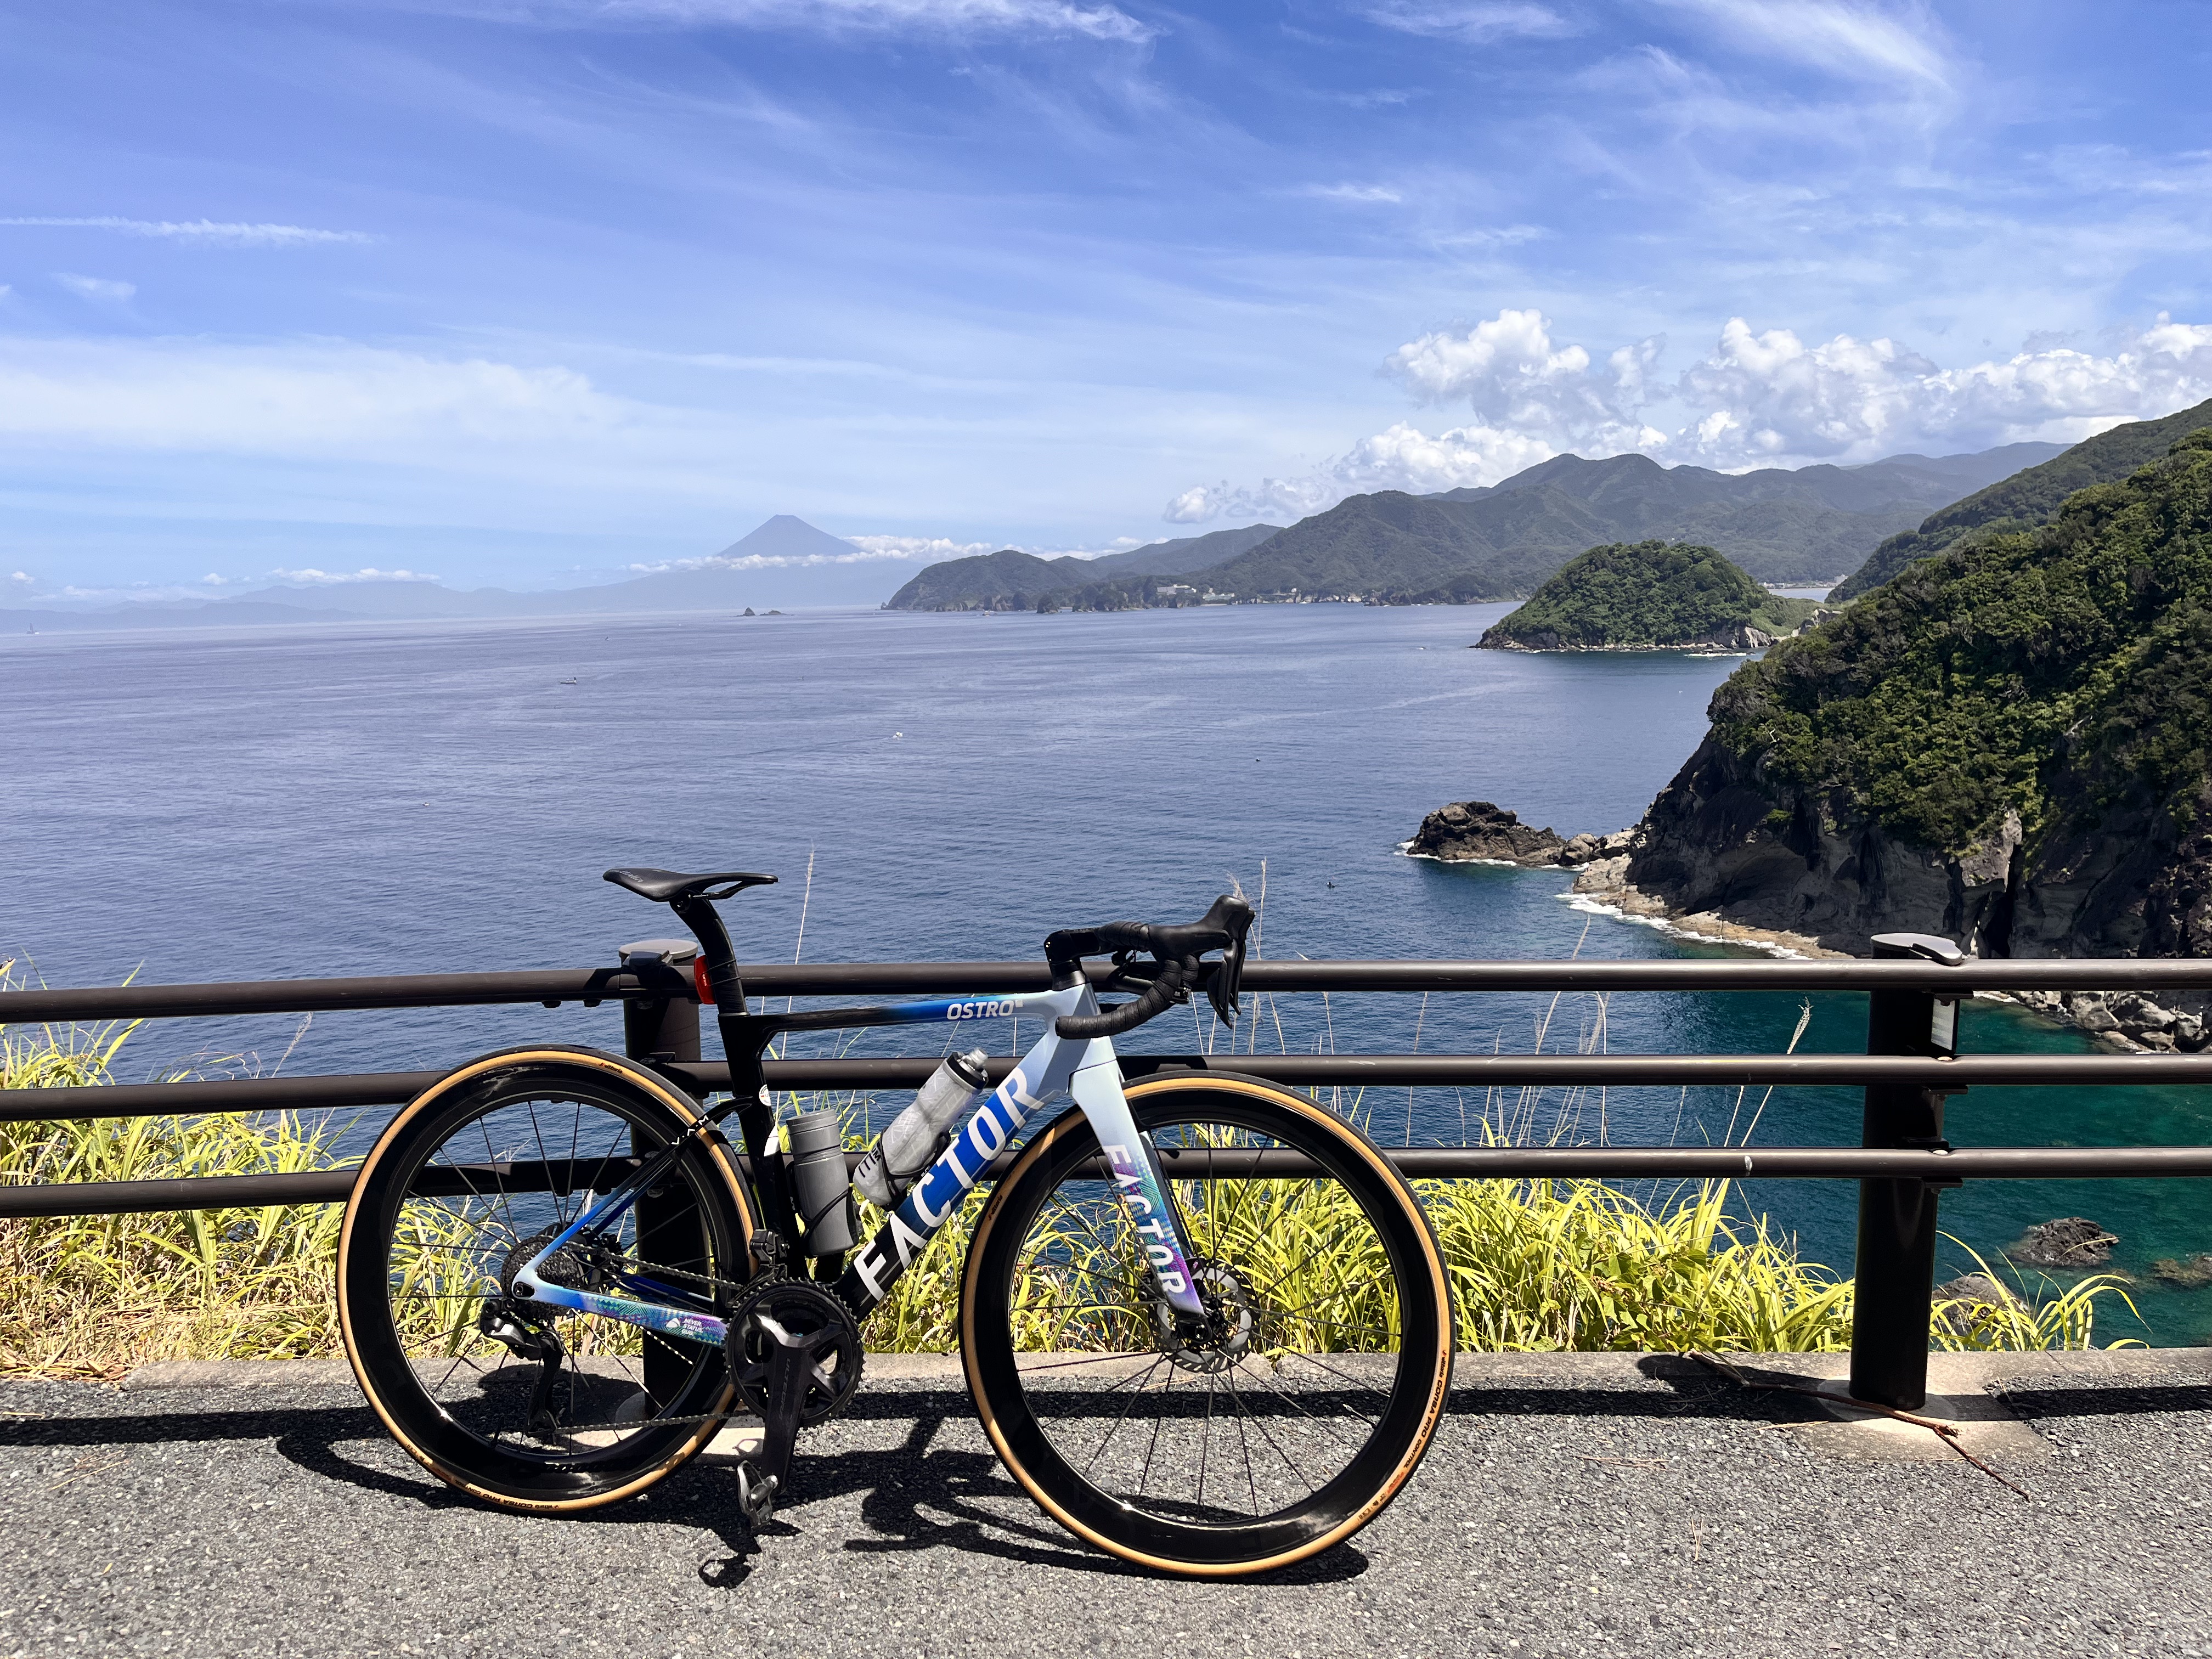
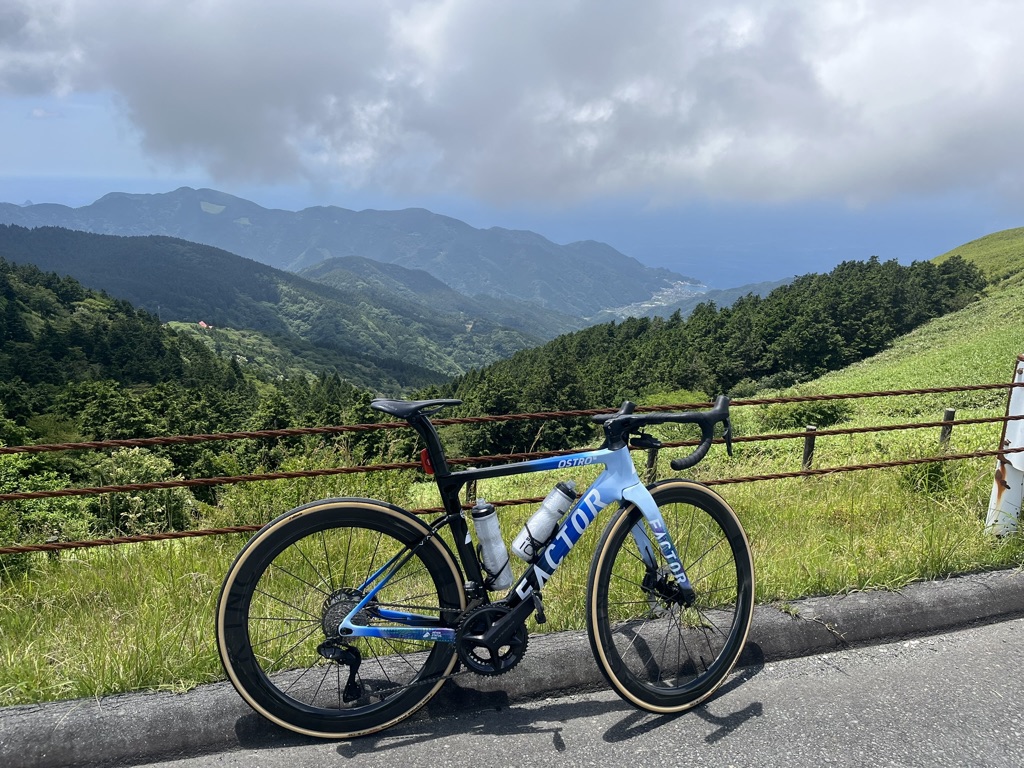
    For me, Taikanzan belongs firmly in the long-climb category. Yet I rather like it. Over the final six kilometers, the road gains altitude and opens up to magnificent views of Sagami Bay, eastern Izu, and even Oshima Island, giving me plenty of scenery to enjoy while breathing heavily.

    It has a real sense of reaching a climax, similar to the feeling I get on Nishina Pass.

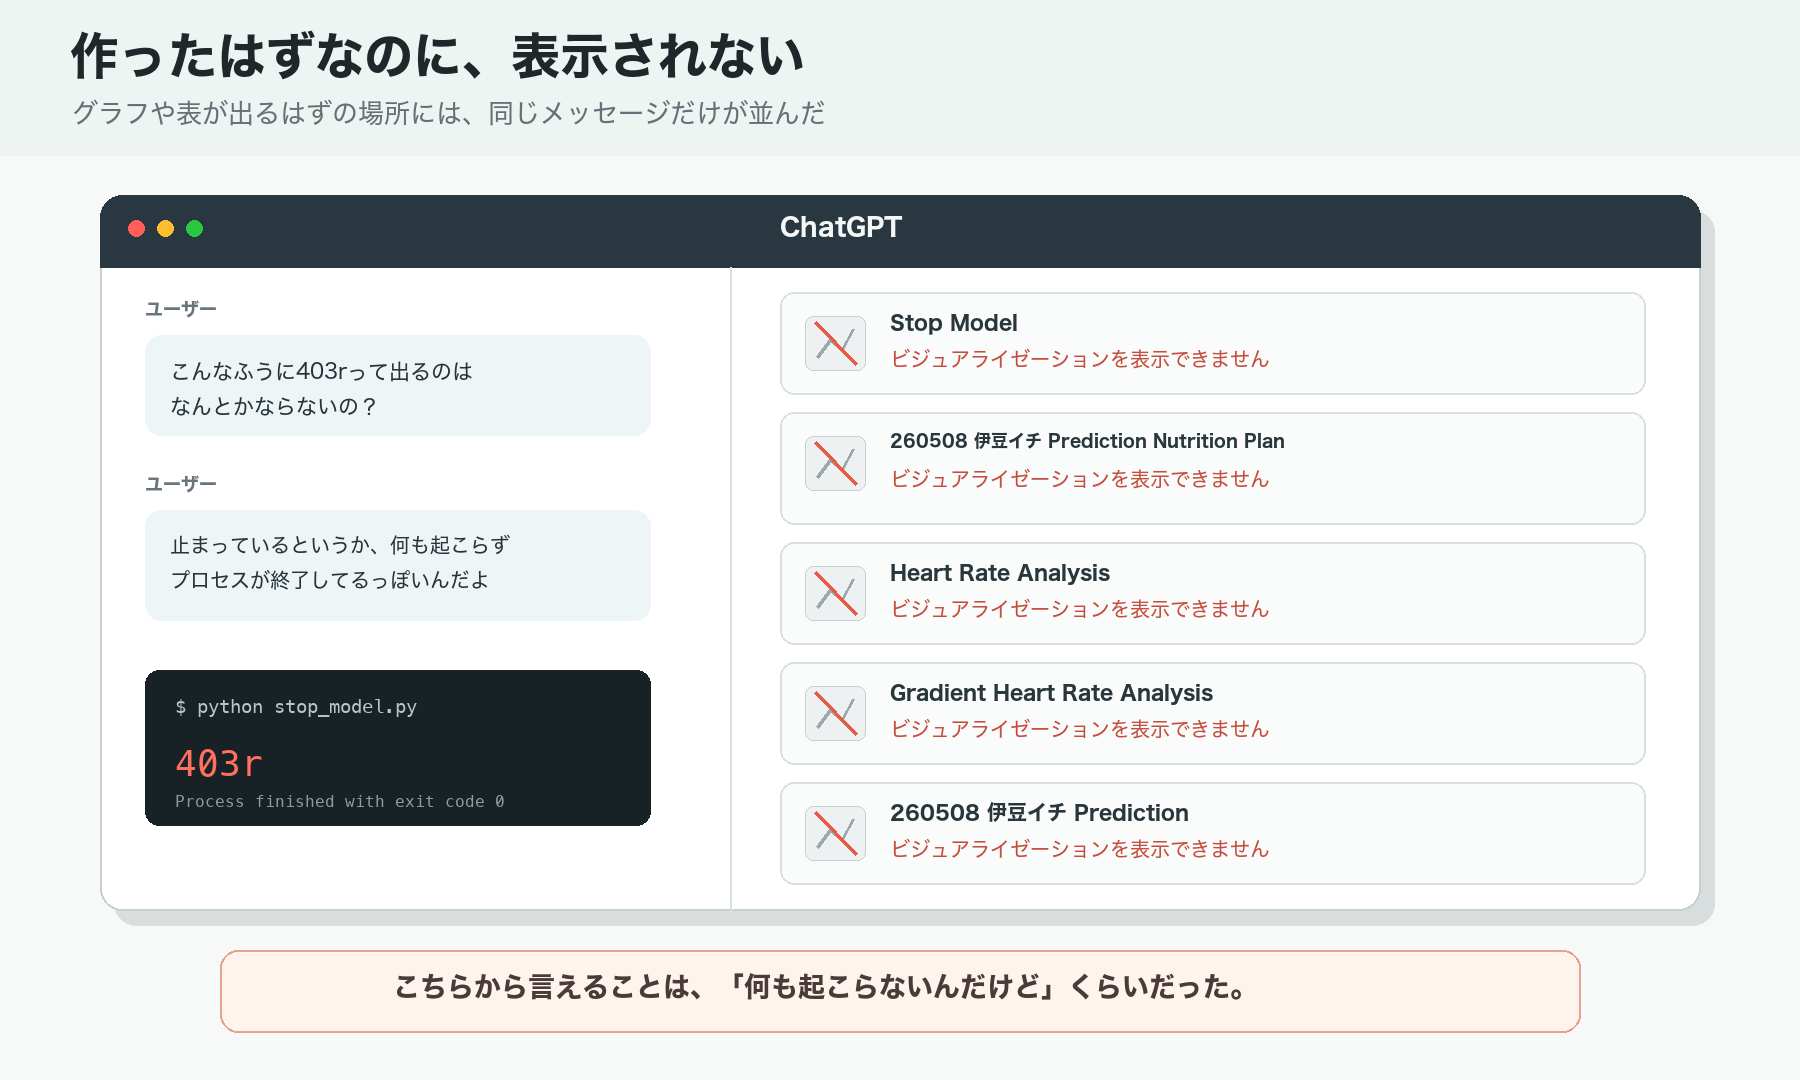
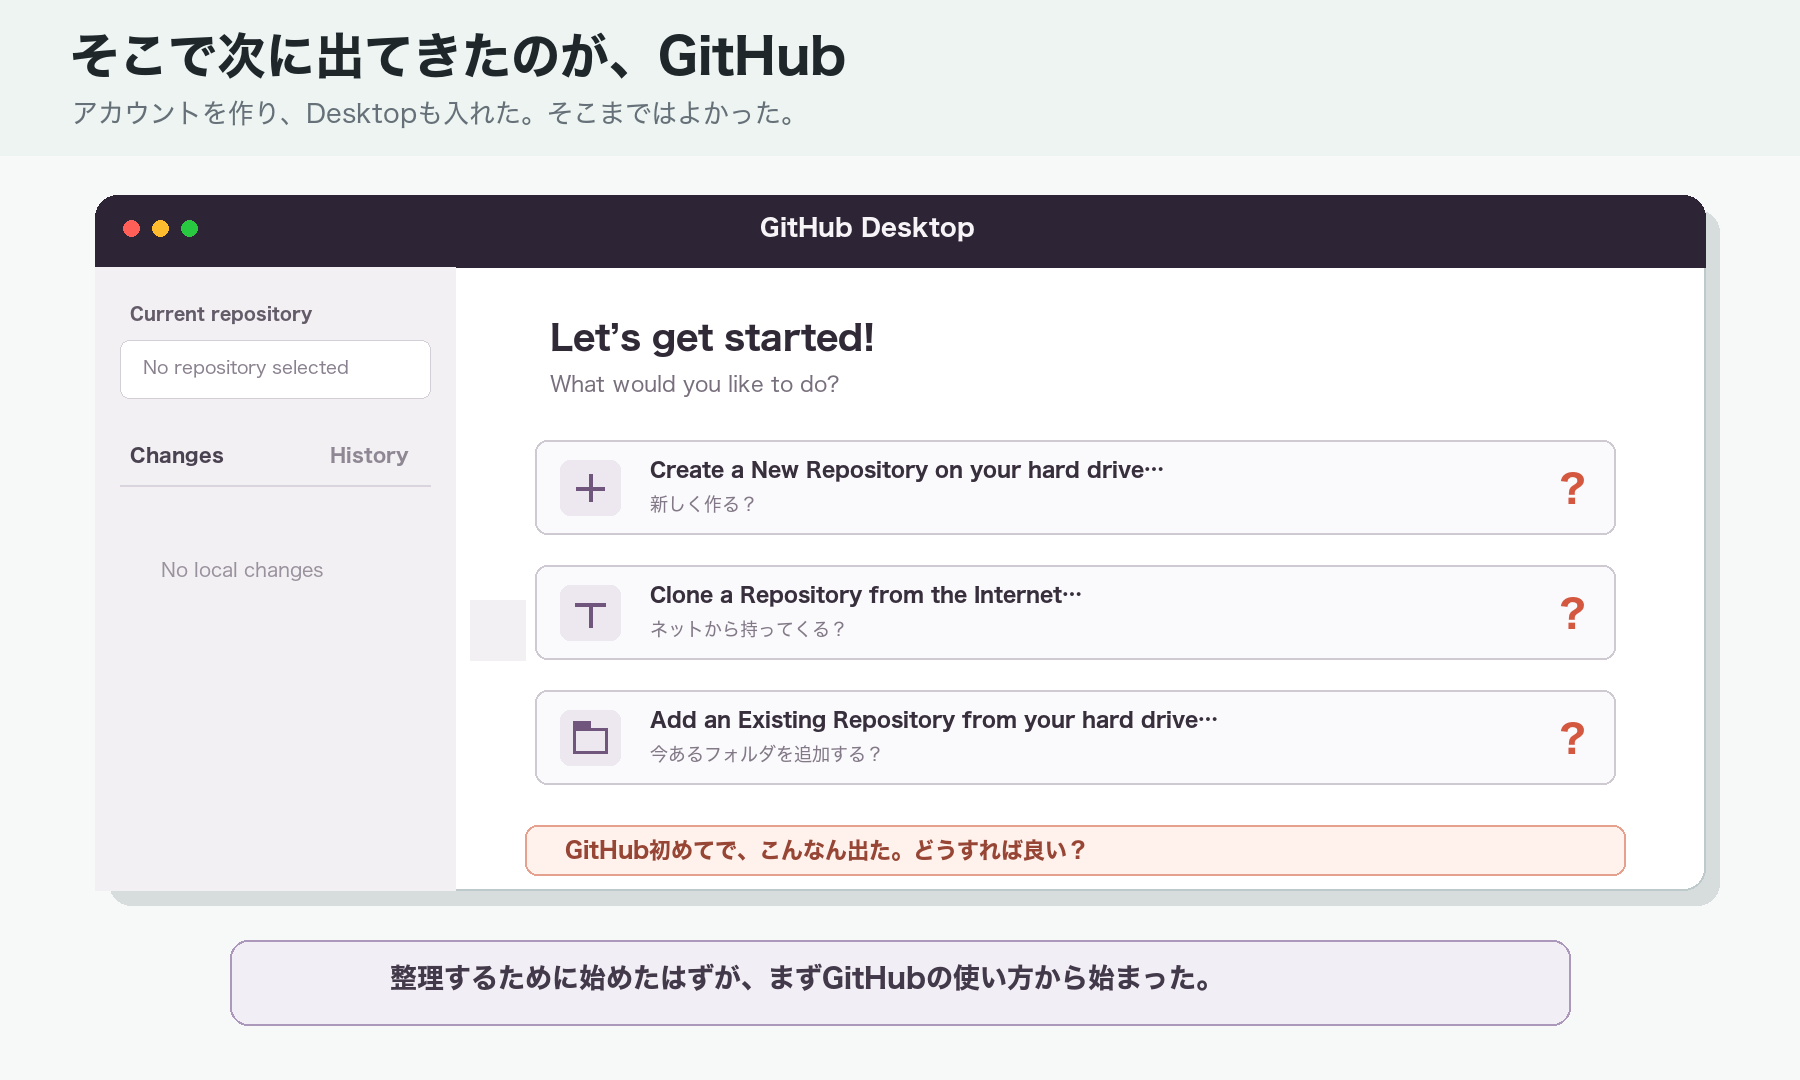
    Some sections of Taikanzan have also been resurfaced, making the descent more comfortable. I left Manyo Park at 8:40 and thought arriving around 10:00 would be good. Riding at a firm but controlled pace, I reached the entrance to Anest Iwata at the summit at 9:57. No need for the long-ride prediction system I have been building. It should still be useful on unfamiliar routes, so I want to continue testing it, but…

    This ride produced no test log.

    I started shortly after 4 a.m., and before I had ridden even five kilometers, my position on the cyclocomputer map stopped moving entirely. It appeared to be receiving a GPS signal, and the distance continued increasing, so I wondered whether only the map display had stopped updating. I kept riding, but in the end no route log was recorded.

    Screenshot

    The distance and elevation gain were recorded in the cyclocomputer app, but the route itself never appeared.

    Screenshot

    Looking at the ride log afterward is one of the pleasures of riding, so it was disappointing not to have one this time. I never saw that coming. Incidentally, the rainy season had just begun in the Kanto region.

    One of the pleasures of Taikanzan is the view of Mount Fuji, but my success rate there is rather low. I have rarely seen it clearly.

    Mount Fuji Should Be Visible… Taikanzan (JP only)

    How about this time?

    As usual, only a tiny part of the summit was visible through a gap in the clouds. I quickly descended toward Lake Ashi, then headed through Sengokuhara toward Nagao Pass. From there, the route continued into Gotemba and toward Myojin and Mikuni Passes. Even so, I was still unsure whether I really wanted to go there.

    They are brutally steep climbs, after all. There is no relaxed climbing mode. The gradients more or less force me to climb at full effort.

    I was already quite satisfied after climbing Taikanzan, and I was intimidated by the fact that I had not yet completed even half of the day’s route.

    Thinking that I was clearly not suited to brevets, I reached Nagao Pass.

    Passing through this tunnel and descending would take me to Gotemba. Should I turn back toward Odawara, or continue? In fact, the shortest route home was over Myojin and Mikuni Passes and down the Doshi road.

    Farewell, Hakone!

    Mount Fuji should have been directly ahead after the tunnel, but the cloudy sky hid it completely as I descended toward Gotemba.

    I believe this was only my second time descending to the Gotemba side. The previous time was years ago, when I passed through Gotemba to climb Ashigara Pass from Oyama.

    Because I was unfamiliar with the town and could not load the route onto my cyclocomputer, I repeatedly checked my phone while heading toward the entrance to Myojin and Mikuni Passes.

    While thinking that I was approaching from the opposite direction to my usual Oyama route, I found myself in front of the Fuji Speedway gate.

    While climbing the pass, I had heard engines roaring below. So this was the source. Fuji Speedway was also the finish of the Olympic road race, making this a small pilgrimage site for cyclists.

    Now, onward to today’s main pilgrimage site.

    This time, I approached from the opposite side. After turning left, I spent about an hour reducing myself to a thoroughly exhausted state.

    And there I was.

    It is not that I remember nothing from the climb. I stood on the pedals through the 18% section, enjoyed a brief moment of triumph while looking down over Gotemba, and admired the Tanzawa mountains after the steepest slopes were behind me.

    I also noticed a new fence around the Olympic monument celebrating Myojin Pass’s 18% gradient. Apparently, it was installed to prevent illegal dumping. That is unfortunate.

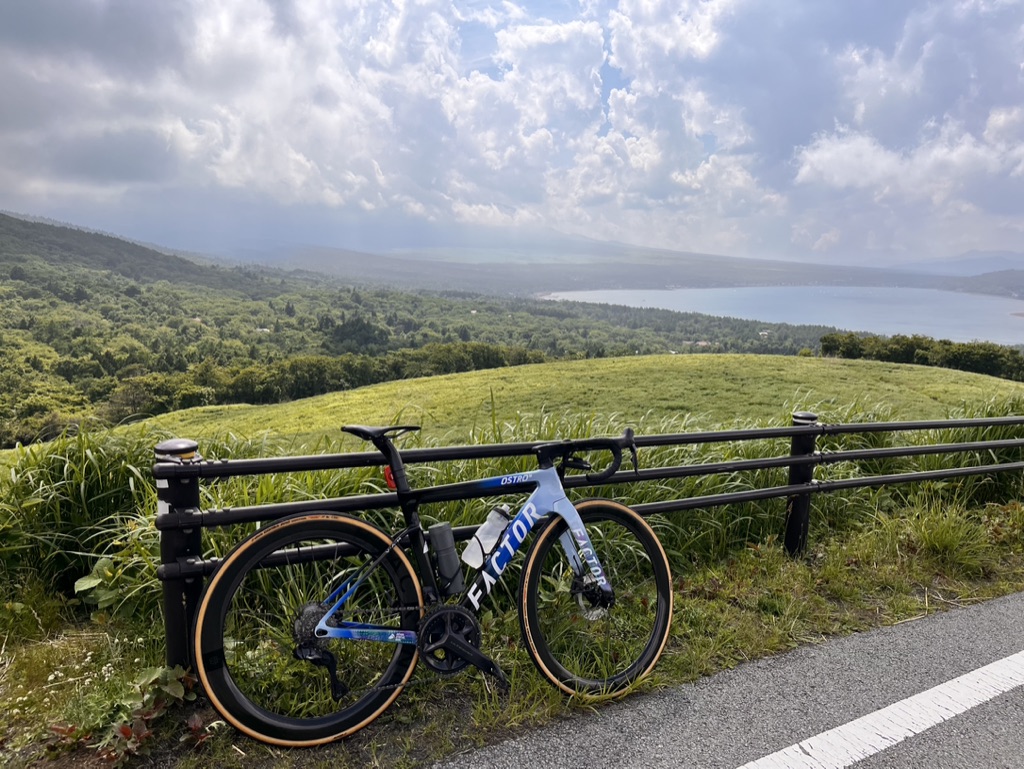
    I reached the pass at 2 p.m. If I descended and left Lake Yamanaka at 2:30, I calculated that I would reach the Lake Tsukui area around 5 p.m. and get home around 7 p.m. With that estimate, I began the descent.

    Mount Fuji was not visible.

    Naturally, it was not visible from Lake Yamanaka either.

    It was time to descend the Doshi road. But first, one small climb to Yamanushi Pass.

    That was the final pass of the day. Only smaller rolling climbs remained.

    A southerly wind was forecast for the afternoon, and fortunately it mostly became a tailwind for the descent. For the first time in a while, I enjoyed a long and satisfying downhill. A brief shower left the road wet for a moment, but progress remained smooth. It was 5 p.m. when I entered Hashimoto.

    I followed my usual route through Onekan toward the Tama River. After forcing myself over the final small climb and emptying the tank, I passed ZEBRA Coffee. I wanted a cafe latte but did not stop.

    Home was only about an hour away, so I thought the gel I had with me would be enough. Still, I could not resist stopping at a 7-Eleven for an iced cafe latte and a sandwich.

    Satisfied, I reached the Tama River and arrived home at 6:30 p.m.

    I was disappointed that the route had not been recorded, but this was approximately the ride I had completed.

    Screenshot

    When I started the cyclocomputer during a short ride the following day, it received the GPS signal normally, so it does not seem to be broken. From now on, if something looks wrong, I will restart it. Recording a backup route on my phone would probably use too much battery.

  • I Just Wanted a Time Prediction, but the Scripts Kept Multiplying

    Building a Long-Ride Prediction Tool with AI, Part 2

    In the previous post, I wrote about why I wanted to build a personal long-ride prediction tool: I wanted to know what time I needed to leave in order to get home before sunset.

    Strava tells me the distance and elevation gain, but it does not really tell me how long a route will take when I ride it, including breaks, traffic lights, and the fatigue that builds up later in the day. So I wondered whether I could make a prediction that better reflected my own riding by using my past ride data.

    This time, I begin the actual prototyping process with help from ChatGPT.

    The plan was to analyze my past rides, predict the time required for a GPX route made in Strava, and create things such as a nutrition plan and a stem sheet. As I kept experimenting, however, analysis scripts and data files began multiplying one after another, until the whole thing gradually became difficult to control.

    First, I Just Wanted a Predicted Moving Time

    The first thing I wanted was simple: load a route made in Strava and estimate how long it would take me to ride it.

    A GPX file exported from Strava contains information such as route position and elevation. That may be obvious to people who know this subject, but I did not even really know what was inside a GPX file.

    So I asked ChatGPT: “I want to read distance and gradient from a Strava GPX file and predict the time using my past ride data.”

    It gave me a Python script for reading the GPX file.

    I placed the files where I was told and ran the script. A CSV file appeared, filled with numbers for distance, gradient, predicted speed, and arrival time.

    Oh. Something came out.

    At that point, I had no idea whether the prediction was correct. Still, I was slightly moved that someone who could not write a program had followed the instructions and produced numbers that looked plausible.

    Predicting from Speed at Different Gradients

    The basic prediction model came from my speed at different gradients in past ride logs.

    How fast do I ride on flat roads? How much do I slow down on gentle climbs? What happens above 5%? How fast do I descend?

    By analyzing past ride logs, it should be possible to see roughly how fast I tend to ride at each gradient.

    The idea was to divide a new route into small segments, apply my predicted speed for each gradient, and then add everything together to calculate the total moving time.

    Real speed is also affected by road surface, traffic, signals, and wind. Even so, using my own past data rather than a general average seemed likely to produce a prediction that was at least closer to me.

    We therefore made a script that analyzed the relationship between gradient and speed in my past data and used it to predict a GPX route.

    Past ride logs divided into segments, plotting average gradient against segment speed.

    At Least It Produced Some Numbers

    When I tried loading my complete-loop route around the Izu Peninsula, the result looked like this:

    Route: 260508_Izu-Ichi.gpx
    Route points: 47447
    Distance: 274.1 km
    Predicted moving time: 13.27 h
    Predicted avg speed: 20.7 km/h
    The first prediction result produced after loading a GPX route.

    For 274.1 km, the predicted moving time was 13.27 hours and the predicted average speed was 20.7 km/h.

    The numbers looked believable.

    It was much more concrete than staring at the distance and elevation gain and trying to estimate everything in my head. At the very least, it gave me a broad sense of whether a route would be extremely slow or reasonably rideable.

    But this was only moving time. It did not include waiting at signals, convenience-store stops, meal breaks, or time spent stopping for photographs.

    What I really wanted was the total elapsed time from departure to return. A ride might start and finish at home, or at a station reached by train, but a moving time of 13 hours does not mean I will be back 13 hours after leaving.

    So how many hours would it take including breaks?

    This is where the story became more complicated.

    Are Break Times Predictions or Suggestions?

    Break time on a long ride varies greatly depending on the day.

    Buying a drink at a convenience store may take only a few minutes, while a meal takes longer. On a hot day I may want to rest in the shade. If the view is good, I will want photographs. Sometimes I find a cafe and get drawn inside for no particular reason.

    Accurately predicting break time is therefore quite difficult.

    We began to think that instead of predicting breaks, it might be more realistic to define a break pattern in advance and use it to calculate total elapsed time.

    For example, take a ten-minute break every hour, take a short break every two hours and a longer one every four hours, or suggest stopping near a convenience store or before a long climb.

    I would not have to follow the plan exactly during the ride. But placing a break plan on top of moving time would make it possible to estimate total elapsed time.

    Just when producing a predicted time felt like progress, a new problem appeared: how should breaks be handled?

    If I Am Doing This, I Want a Nutrition Plan Too

    Once I started thinking about breaks, nutrition naturally became important too.

    On a ride longer than ten hours, where and what to eat matters greatly. If delayed nutrition causes a major collapse later, the prediction for getting home before sunset becomes meaningless.

    At first, I thought hourly predicted locations would be enough. But if the tool could calculate a location for every hour, perhaps it could also show a nutrition target there.

    How many calories should I consume each hour? Should I eat before a long climb? Before entering a long section without convenience stores, how much water and food should I buy?

    If the tool could show those things, it would become a usable ride plan rather than only a time-prediction table.

    So I began making a nutrition plan too.

    A nutrition plan combining predicted locations with fueling and convenience-store information.

    In addition to the prediction CSV, the outputs gradually expanded to include a nutrition plan, heart-rate analysis, gradient-versus-heart-rate analysis, a stem-sheet PDF, graphs, and tables.

    Whenever I thought of something and asked, “Can it output this too?”, ChatGPT usually made something.

    I got carried away by how convenient it was, and the situation gradually became troublesome.

    The Analysis Scripts Begin to Multiply

    When building something through conversation with AI, each new request tends to produce a new script.

    One reads GPX files. One creates a gradient-based speed model. One creates a nutrition plan. Others make PDFs, graphs, or charts.

    At first, each script looks useful because it has a clear role.

    After repeated revisions, though, I gradually stopped understanding what I had.

    Which script was I currently using? Was this the old one or the revised one? Which script produced this CSV? What settings were used when this PDF was created?

    I saved every new script ChatGPT gave me, but I had no system for knowing which one was now correct.

    Sometimes a requested revision even seemed to return to something made much earlier.

    In the chat, I actually said, “It feels like we may have gone back to something made quite a while ago.”

    I was completely lost.

    Analysis scripts and output files multiplying with every new request.

    This was less a problem with AI than a result of my own lack of development and project-management knowledge. I was simply saving whatever appeared and moving forward.

    Someone accustomed to development would organize the purpose of each file, manage change history, and make it clear which version was current. I was fully occupied just pasting the code I was given and running it.

    The number of useful things was increasing, while the overall picture was becoming harder and harder to see.

    It Does Not Fit on the Stem Sheet

    There were also problems on the output side.

    As I added more information to the stem sheet, I naturally ran out of space.

    The size that can be taped to a bicycle stem is limited. I tried to include hourly distance, estimated arrival time, nutrition, convenience-store availability, and route type. In the first table, the text overlapped.

    “Fuel” extended outside its column. Words overlapped and became unreadable. Something that looked fine at a large size on screen became useless when reduced to stem-sheet size.

    An early stem sheet with too much information and overlapping text.

    So I began shortening the displayed words.

    Mountain became M, convenience store became CVS, water became WTR, gel became GEL, and onigiri became ONI.

    This is how the stem sheet filled with mysterious symbols from the previous post was born.

    M350, ONI+GEL/WTR, CVS NO.

    The finished stem sheet after replacing long words with abbreviations.

    It may look like a code to anyone else, but it works for me. During a ride, short symbols are easier to read than long explanations.

    This process also taught me that adding more information does not always make something more useful. In a limited space, deciding what not to include is just as important as deciding what to add.

    “Unable to Display Visualization”

    During prototyping, I repeatedly encountered displays that I did not understand.

    “Unable to display visualization.”

    ChatGPT seemed to have created a graph or table, but I could not display it. Sometimes nothing appeared at all, even though the process seemed to finish. At one point, mysterious text such as “403r” appeared on screen, leading to another conversation about what it could possibly mean.

    The “unable to display visualization” state that repeatedly appeared during prototyping.

    Someone familiar with programming would probably read logs and isolate the cause. About all I could say was, “Nothing happened.”

    I described the screen and displayed text to ChatGPT, pasted output when necessary, received a correction, and tried again.

    It moved a little, broke a little, I asked again, and we fixed it again. That was the repeated process.

    It was not like asking AI and receiving a magically complete result in one attempt. The process was quite messy, but this is probably what it actually looks like when a beginner tries to build something with help from AI.

    Still, It Gradually Takes Shape

    The files increased. The outputs increased. Sometimes I no longer knew which version was current.

    Even so, the project gradually moved closer to what I had originally wanted.

    Loading a GPX file produced a predicted moving time from distance and gradient. My speed at different gradients could be applied from past ride data. The tool began producing total elapsed time including breaks, rough nutrition guidance, hourly locations, and something that could be printed as a stem sheet.

    I still could not write the code myself or understand every part of the system. But by repeatedly explaining what I wanted, looking at the result, and asking for changes, it gradually took shape.

    It was a very interesting experience.

    At the same time, it became clear that if I continued adding features without organizing anything, the project would eventually collapse completely.

    Time to Organize Everything

    In the chat, I said: “There are too many scripts and too much data appearing, and everything is getting mixed together. Let’s stop and organize it.”

    That was exactly right.

    Keep what is necessary and remove the rest. Clarify what each script does. Separate input files from output files. Turn the final workflow into a single clear path.

    Trying to separate inputs, processing, and outputs into one clear workflow.

    By this point, continuing the prototype only through conversation with ChatGPT was becoming difficult.

    Receiving code in the chat, running it locally, pasting the result, and asking for corrections could still move the project forward. But as files multiplied and several functions began to depend on one another, management became increasingly difficult.

    I also wanted a simple application where selecting a route would generate the necessary outputs together, instead of running each script separately. At that point, I began to feel the limits of working only through chat.

    That is where GitHub entered the story.

    But GitHub was new to me too. I created an account and installed GitHub Desktop, and naturally found myself looking at another screen I did not understand.

    What was I supposed to do now?

    Opening GitHub Desktop to organize the project, only to begin by learning how to use GitHub Desktop.

    Next time, I will write about organizing the prototype created with ChatGPT, shaping it into a simple application, and moving toward development with Codex.

    This is where the story finally begins to shift from “making a prediction table” toward “making a tool that can actually be used.”

  • What Time Should I Leave to Ride 200 km and Get Home Before Sunset?

    Building a Long-Ride Prediction Tool with AI, Part 1

    In the previous post, I wrote about building a long-ride prediction tool with help from AI and then taking it out for a test ride to West Izu.

    The idea was simple enough: load a route created in Strava, have the tool estimate the total elapsed time and where I would be every hour, then put nutrition cues and convenience-store availability into a stem sheet, with a map I could check on my phone.

    When I actually tried it on a route of about 220 km with roughly 4,000 m of climbing, the predicted elapsed time was 13 hours 17 minutes. The actual elapsed time was 13 hours 23 minutes. A six-minute difference on the first real test was, frankly, far better than I expected.

    That previous post, though, was mostly about the ride itself. I barely touched on the more important question: how did I actually make that thing?

    This is the development story.

    Before going any further, I should say this clearly: the AI is not making riding decisions inside the prediction tool. I talked things through with AI, asked it to help with design, code, and corrections, and gradually built a prediction tool for my own use. I cannot really program, and this was also my first time using AI for this sort of purpose.

    So why did I want to make something like this in the first place?

    When planning a long ride, I often find myself wondering how long a route will actually take.

    Strava can tell me the distance and elevation gain. It also gives a rough estimated time. But I have always treated that as a rough guide. It does not really tell me how long the route will take when I ride it, including breaks, traffic lights, food stops, and the fatigue that builds up in the second half.

    Once a ride gets longer than ten hours, distance and elevation alone are not enough.

    The same 200 km ride can feel completely different depending on whether it has 2,000 m or 4,000 m of climbing. It matters whether the major climbs come early or late, whether the route is a chain of rolling climbs, whether the city sections have endless traffic lights, or whether there is a 40 km stretch with almost no stopping. All of those things change the actual riding time quite a lot.

    With that in mind, I wanted a way to make predictions that were a little more specific to me.

    I Want to Get Home Before Sunset

    The root of this whole idea was not simply, “What time will I get home?” It was more like, “What time do I need to leave if I want to get back before sunset?” That might sound like the same question, but for me there is an important difference.

    The roads near my home are urban, so unless it is late at night or very early in the morning, there is a fair amount of traffic. At the end of a long ride, when fatigue has built up, I would rather not be riding through the city at dusk.

    It is the same in the countryside or in the mountains. I would prefer not to ride unlit roads after dark, especially on unfamiliar routes where the road surface is hard to read.

    So the goal was not just to predict whether I would return at 8 p.m. or 11 p.m. It was to know how much margin I needed at the start in order to get back safely before sunset.

    Of course, if I was going to build a route-wide prediction system, I also wanted to include information that would be useful during the ride.

    Where would I be after each hour? Where could I refuel? Which sections had no convenience stores? Where should I plan a longer break? Would the pace I was riding at make me fall apart later? I gradually started wanting all of that information in a form I could check both before and during the ride.

    Strava Alone Is Not Quite Enough

    Strava route planning is useful.

    It shows distance, elevation gain, and the overall shape of the course. For linking together roads I do not know and planning a long ride, it is a very dependable tool.

    But it is harder to get more detailed information, or predictions that reflect my own riding characteristics.

    For example: total elapsed time including breaks and traffic lights, predicted locations for each hour, calories to take in, timing for water refills, sections with no convenience stores, weather and rain risk on the day, and how much I should eat before entering a long climb.

    Those things are difficult to see from general averages.

    Even for the same 200 km distance, the time required varies depending on the course profile and the rider. Some people are strong on flats but slow down a lot on climbs. Some are not especially fast but can keep going steadily into the second half. Some are better with frequent short stops, while others feel worse if they stop too much. Age obviously matters, and so do cycling history and general athletic background. Strava gives a broad sense of trends, but I did not feel it could give me a prediction truly adapted to me.

    So I wondered: could I use my own past riding data to make a prediction tool for myself?

    First, I Asked AI

    Once I had thought that far, I started asking AI.

    I do not know much about programming, data analysis, or exercise physiology. So from the beginning, I threw the problem at it rather bluntly.

    I want to know the predicted elapsed time and hourly locations for routes longer than ten hours. I have my own past ride data. I have heart rate, cadence, and speed, but no power meter. I do not yet know what kind of system it should become, but I want to build it while discussing it.

    That was more or less how I started.

    The AI seemed oddly enthusiastic.

    It said that instead of a simple route completion estimate, I might be able to build something like a personal adaptive pacing strategy engine for long rides by combining my own fatigue model, nutrition model, stopping tendencies, terrain adaptation, and weather tolerance.

    A personal adaptive pacing strategy engine.

    Suddenly it sounded grand.

    But I understood the idea.

    In other words, it would not be based on the average cyclist. It would be based on my own past logs. How fast do I go on a 5% climb? How much do I slow down after 150 km? How does my heart rate behave on hot days? How much does my pace drop at night or when tired? What kind of break interval keeps me stable?

    If those pieces of information accumulate, the prediction should move closer to “this is what will probably happen to me,” rather than “this is generally what happens.”

    Of course, at that point nothing existed yet. It was only a conversation, and the dream was expanding.

    Still, it was enough for a first step.

    I Do Not Have a Power Meter

    One thing I was slightly concerned about was the lack of a power meter.

    What I use is basically a heart-rate sensor, cadence sensor, and speed sensor. At first, I wondered whether that meant I could not do anything very meaningful.

    But when I asked AI, the answer was that even without power data, there was still a lot of information that could be useful for long-ride prediction.

    How heart rate changes. How much speed drops at different gradients. How cadence changes when fatigue builds. Long-duration declines in cruising speed, stopping frequency, and whether I recover properly after breaks might also be visible in past logs.

    Even without power, tracking those changes might still reveal something about how long I can keep riding without falling apart.

    I found that very interesting.

    How steadily can I ride in a long ride? Where do I tend to slow down? What kinds of conditions wear me down?

    To get home before sunset, that is the kind of thing I need to know. I am not racing.

    Listing What I Wanted

    What I wanted at first was the total elapsed time, including breaks and traffic lights. I also wanted predicted locations for each hour.

    As I thought about it more, I started wanting more: where to take breaks longer than 15 minutes, how much food to carry, what the weather and rain risk looked like for the ride day, and how much I should eat before entering a long climb.

    Written out like that, it sounds greedy.

    But as long-ride planning information, all of it is genuinely useful.

    Especially on routes longer than ten hours, small decisions along the way affect the second half. Starting too hard, delaying nutrition, underestimating the heat, assuming there will be a convenience store and then finding nothing for a long stretch. Small things like that can become the cause of a much bigger collapse later.

    So what I wanted was not just an arrival-time prediction, but a broader planning tool for long rides.

    Long Rides Are About How You Fall Apart

    There is one more important idea.

    In a long ride, how you fall apart is harder than how strong your legs are.

    That phrase also came out of my conversation with AI, and it felt very true.

    Of course leg strength matters. Being able to ride faster is useful. If you are strong on climbs, you can choose a wider range of routes.

    But the really difficult part of a long ride is not how fast you can go in the first half. It is how little you fall apart in the second half.

    The same 5% climb is completely different at 30 km and at 180 km.

    A climb that feels manageable early on can suddenly bite hard later. Heat drains you. Delayed nutrition makes it hard to produce force. A long stop can leave the body feeling heavy. If it gets late at night, sleepiness enters the picture too.

    All of those things accumulate, and at some point the pace can suddenly drop.

    That, I think, is what is frightening about long rides.

    Being a little behind schedule is fine. But if fatigue or poor fueling causes a major collapse in the second half, the whole plan to get back before sunset falls apart.

    So what I really want to predict may not be simply “this gradient means this speed.” It may be closer to “after riding this far, in this condition, what happens when I enter this climb?”

    Suddenly it had become much more difficult.

    I Cannot Build Everything at Once

    Once I started thinking this way, the list of things I wanted kept growing.

    Fatigue, nutrition, breaks, weather, wind, temperature, sunset, convenience stores, city traffic, traffic lights, long climbs, late-ride fading. The more I thought about it, the more variables I wanted to include.

    It was starting to become a lot.

    But trying to build everything from the beginning would probably break the whole project.

    So I decided to think much more simply at first.

    The first thing to build should be a tool that reads a route and uses my past ride data to estimate finishing time and predicted speed by segment. Then it should add hourly predicted locations and, if possible, rough nutrition guidance.

    That should be enough for the first version.

    Even that alone should reduce a lot of the anxiety before a long ride.

    At this point, the first shape of the tool was beginning to appear.

    Load a route made in Strava. Use my past riding data to predict speed from gradient and distance. Add total elapsed time including breaks, hourly locations, nutrition, and convenience-store information. If I could do that, it would become much easier to decide what time I needed to leave in order to get home before sunset.

    I Want a Stem Sheet

    The first output format that came to mind was a stem sheet.

    I have always had a little admiration for the way professional riders tape course information and nutrition plans to their stems.

    If I were to do the same thing for a long ride, it would be useful to have hourly predicted locations, nutrition timing, convenience-store availability, and break cues compressed into a small format.

    It is easier to glance at something on the stem than to pull out a phone. At least as a first idea, it felt quite realistic.

    That was when the first goal finally became clear.

    Read a GPX route created in Strava. Use my past ride data to predict total elapsed time. From that, calculate predicted hourly locations, add nutrition and convenience-store information where possible, and finally output it in a printable stem-sheet format.

    That was enough for the first target.

    Looking back, this was still the peaceful stage.

    What began as the question “What time should I leave if I want to get home before sunset?” had already started turning into a personal long-ride prediction tool.

    So how would I actually build it?

    That was where the hard part began.

    Next time, I will write about the prototype stage: analyzing past ride data with ChatGPT, trying to create gradient-based speed estimates, nutrition plans, and a stem sheet, while scripts and output files multiplied faster than I expected.

    At this point, I still had no idea that I would eventually end up making a phone map with current-location display as well.

  • I Built a Ride Schedule Prediction System and Took It for a Test Ride

    I have always wanted to try making something like this.

    You know how pro riders often tape a stem sheet to their bike with a nutrition plan, course profile, and so on? I wanted to imitate that.

    Whenever I go on a long ride, I usually estimate the total elapsed time including breaks before deciding when to start. Even while riding, I often try to predict how many hours it will take from where I am to the next pass. On routes I have never ridden before, I also check whether there are convenience stores along the way and think about how much food I should carry.

    I had been thinking that if I could make those predictions neatly and tape the plan to my stem, it would be useful. I just was not sure whether an app that could do that already existed.

    I could have looked it up, of course, but AI has been advancing at a ridiculous pace lately. Apparently, even without knowing much about programming, you can now make app-like things by saying, “I want to do this.” So I wondered if I might be able to make one myself. That was where this all started.

    From there, every step went more or less like that: a long back-and-forth chat.

    The goal became to take a route created in STRAVA, predict the gross riding time, and output the predicted distance reached each hour as a PDF small enough to tape to the stem.

    I used ChatGPT Plus, thanks to a one-month limited-time free upgrade, and something called Codex. I do not really understand it, except that people say it is “amazing.” My knowledge of AI is about that shallow. I am still the kind of low-IT-literacy person who searches on Google and works down from the top results until I find what I need.

    The whole process was confusing and full of trial and error, so I may write about the details another time. Roughly speaking, the flow was this.

    1. Understand my own riding tendencies

    To make predictions, I first needed to understand myself. I downloaded past ride data from STRAVA and had it analyzed in various ways. When I asked how to do that, ChatGPT explained the steps.

    2. Use the analysis results to output a predicted schedule as a PDF

    At first, I only wanted a list of the predicted distance reached every hour. But as I kept going, I realized it could do more, so I started asking for things like “show whether there is a convenience store in this section” and “calculate recommended calories.” The amount of information kept growing until it no longer fit on the stem sheet.

    3. I got greedy and wanted it displayed on a map too

    Once the stem sheet started working, I wanted more. I asked it to output a smartphone map showing hourly predicted points, convenience store availability, and even current location. I had no idea how to handle that part either, and there was plenty of trial and error, but I somehow got it to land.

    In short, I kept asking, “I want to do this. How do I do it?” and it kept replying with things like, “Paste this into such-and-such.”

    With an input screen like this, I can select a route map made in STRAVA and get the result.

    This is the stem sheet when the start time is set to 4:00 a.m.

    There are some mysterious abbreviations on it. That is because if the words are written out normally, they exceed the column width, overlap, and become unusable. For example, on the 9h row, “M350” means a Mountain route, in other words a route including serious climbing such as passes, plus the recommended calorie amount. “ONI+GEL/WTR” means to resupply with onigiri, gel, and water. Onigiri is not absolutely required, but ChatGPT kept recommending it, so I went with it.

    “CVS NO” means there is no convenience store near that point on the route. This was one of the things I realized I wanted while building the system. If I see that, I can think, “Okay, I need to buy snacks for the next two hours here.” That is useful.

    As I kept building it out, I started thinking it would be even better if the convenience stores near each predicted hourly point could be shown on a map. So I ended up making a map that displays convenience-store availability at each point.

    Then I added predicted arrival time and current location as well. By that point, it had become a fairly packed specification.

    Because it is possible to keep adding things endlessly, I started wanting to cram in “this too, and that too.” But there is no end to that, so I decided to stop at a reasonable point and take it on a test ride.

    I printed the PDF using a network print service and taped it to my stem. I splurged a little and printed it in color on glossy paper. 120 yen per sheet. Expensive.

    The test route this time was a one-way self-powered ride out to West Izu. On the way, I would stop at Atami to leave my luggage, ride around West Izu, and return to Atami: 220 km with 4,000 m of elevation gain.

    The stem sheet and map were generated assuming a 4:00 a.m. start, but in reality I started one hour earlier, at 3:04.

    Before dawn, I headed south along Nakahara Kaido. The prediction said I would have covered 18 km after one hour. I rode along the rolling road wondering how close it would be, and almost exactly at the 18 km point, one hour had passed. I surprised myself.

    Two hours in, the progress was still almost exactly as predicted. The sun was already up, and I rode on under clear skies toward the Kaname River area.

    Mt. Fuji was visible through the haze. I hoped it would stay out from behind the clouds, and checked the map I had made on my phone.

    It shows things like current location and estimated arrival time at the final point. “Schedule” says I am 64 minutes ahead because the output was made assuming a 4:00 a.m. start. Since I actually started at 3:04, I was really only about eight minutes ahead. Confusing. I need to improve that part.

    Thinking about things like that, I passed Odawara, rode beside the calm Sagami Bay in a very good mood, and arrived at Atami Station. Finally, I could drop off my backpack and become lighter.

    From here I would climb Yamabushi Pass from Izu-Taga, but then I had a thought.

    On this route, the section from Atami to Shuzenji overlaps between the outbound and return legs. Even if the map can get my current location, if it cannot tell whether I am on the outbound or return leg, it might calculate the ETA as if I were already on the way back, even though I am still in the first half of the ride.

    Hmm. I had not considered that at all. With that in mind, I climbed Yamabushi Pass for the first time in a while. It is a steep one, but only about 4 km long, and near the pass there is a wonderful section overlooking Sagami Bay, so I like this climb.

    Outbound Yamabushi Pass finished. It was 8:40 at that point. When I checked the prediction map, the ETA was after 9:00 a.m., which meant the system thought I was on the return-side Yamabushi Pass.

    I rode down toward Shuzenji thinking I would have to fix that. The map issue aside, the schedule on the stem sheet was still only about 15 minutes behind my actual progress. Even six hours after the start, the prediction accuracy was fairly good.

    From Shuzenji I headed to the roadside station at Tsukigase. This time I was riding a standard route: south from Toi to Ugusu, then climbing Nishina Pass and heading north on the West Izu Skyline. The climbing route to Nishina Pass was in a period with partial construction restrictions, but I found out that those only applied on weekdays, so I could include it in the route.

    I stopped at the Tsukigase roadside station for a break. I had not planned to stay long, but when I saw a kitchen truck selling “ultimate fresh juice,” I decided to try it.

    Mandarin orange! Mandarin orange! So good! I demolished the small size instantly.

    I wondered if I should have gone for the large, but if my stomach got too full, the gentle climb toward Funabara Pass afterward might bring it back up. So I think it was the right choice.

    After that I restarted and headed toward Toi. I passed through the Funabara Tunnel, enjoyed the descent to Toi, and arrived there at 10:30. At that point I was about 30 minutes ahead of the prediction.

    I made a rough calculation: if I rested here and left around 11:00, I would reach Ugusu around 11:30 to 11:45. I could rest and resupply at the convenience store there, then spend about 1 hour 15 minutes climbing to Nishina Pass and arrive around 13:00. I figured I would probably return to Atami by 17:00 at the latest.

    In practice, if I became too fixated on the stem sheet prediction, I might end up being controlled by it, which would defeat the purpose. I started thinking it was fine to rest when I wanted to rest, and if I did not need a full break, just stop briefly and eat some food.

    The toast in the toast set had a nice milky flavor and was quite tasty.

    I stared out at Suruga Bay for a while and let my mind go blank.

    At this point I had ridden 140 km, so in terms of distance I was nearly two-thirds done. But Nishina Pass and the West Izu Skyline still lay ahead, so mentally it still felt like I was before the halfway point.

    I restarted at 11:00 and headed for Ugusu.

    Looking back along the way, I could see Mt. Fuji clearly from the gentle climb. I arrived in Ugusu at 11:30, just as predicted. The prediction system was doing well, but my old-fashioned personal estimate was not bad either.

    I topped up drinks and food, and finally headed for Nishina Pass.

    The ridge of Nishina Pass rose straight ahead beyond a short flat section. It was not an immediate wall of gradient, but a perfect little prologue to build excitement. Even knowing it would be hard, I felt thrilled.

    Once the gradient became serious, the road was still relatively covered by trees, but the strong summer-like sun was beating down. My full 700 ml bottle was disappearing quickly. I got through a curve that apparently has an inside gradient of 30%, reached a short flat section, then returned to double-digit gradients. Eventually the road opened up with Suruga Bay below, and that was Amagi Kogen Farm.

    I passed beside a cowshed, and for the first time on this route I saw cattle grazing calmly in the pasture. They all looked at me with somewhat suspicious expressions.

    After all that, I reached Nishina Pass. The time was exactly 13:00. My own prediction was perfect. According to the stem sheet, I should already have descended from there and be around the climb after Kazahaya Pass, so I figured I was a few minutes behind, and ate the bite-sized warabi mochi I had bought along the way.

    From here, only the climb to Mt. Daruma on the West Izu Skyline and the climb to Yamabushi Pass on the Ohito line remained. It was 60 km to Atami.

    I calculated that I could reach Shuzenji in about two hours and restarted toward the West Izu Skyline. Mt. Fuji, which had been hidden by clouds for a while, was visible at key spots, so I expected the classic viewpoints to be good.

    Before entering the West Izu Skyline, I descended quite a bit and then climbed for about 30 minutes toward Mt. Daruma. Along the way I could see the road down to Toi far below, the same road I had descended that morning. It made me feel how far I had ridden.

    Near the end of the climb, I looked back and could see Nishina Pass far in the distance. From there I descended briefly to the parking area before Mt. Daruma, where you can look down toward Heda.

    Then I climbed back a little, rounded Mt. Daruma, and descended again.

    I came here entirely under my own power! I used to think this area was impossible unless I started from Numazu, Shuzenji, or maybe Ito. I never expected I would come here by riding all the way myself.

    As I descended toward Shuzenji Station, I was thinking I would eat shiitake soba at the attached Izura shop. As I lost elevation, the heat returned, and I started leaning toward cold soba instead.

    The large portion was quite generous, but the cool soba felt so good going down that I finished it easily.

    After taking a breather, I restarted. Yamabushi Pass has about 7 km of gentle climbing before the serious part begins. After that, it is just under 4 km with sections around 10%, and then it is done. The hard part was almost over.

    Before I knew it, I had arrived at Yamabushi Pass with the western sun shining from this side. It was 15:50, only a few minutes behind the planned progress. Thinking I would reach Atami Station around 16:30, I started the final descent.

    When it comes to Yamabushi Pass, this bridge view over Sagami Bay is the perfect closing moment for a long ride. A small breath of relief.

    I returned to Route 135 and headed for Atami. In the city, I got caught by more traffic lights than expected, but at 16:28 I arrived in front of the station coin lockers and stopped the computer.

    The predicted gross ride time was 13 hours 17 minutes, while the actual elapsed time was 13 hours 23 minutes. The prediction system I made turned out pretty well.

    What surprised me most was that the accuracy was this good despite including the uncertain elements that are part of any long ride, such as cafe and soba breaks in addition to convenience-store stops. Of course, when building the prediction system, I had designed it to include those factors in the gross ride time and intermediate progress predictions, but it seems more usable than I expected.

    Now I want to keep improving the map and reconsider the contents of the stem sheet so that the whole thing becomes easier to use.

  • All the way to Kawazu-zakura

    It is the famous Kawazu-zakura that begins to bud from early to mid-February, just as the Tohi-zakura petals have fallen. Among the early-blooming cherry blossoms, it is perhaps one of the most well known. This variety is called Kawazu-zakura because its original tree stands in Kawazu, in eastern Izu near Shimoda. However, these cherry trees are not limited to Kawazu or even to Izu—they have been planted in many other places as well, bringing vivid color to this still-chilly season.

    Although the blossoms can be enjoyed in many regions, it is best to visit Kawazu itself, the source of this variety.

    Since it takes only about a week from the start of blooming to full bloom, timing your visit can be difficult. Still, the uninterrupted row of cherry trees stretching several kilometers along the Kawazu River from its mouth is well worth seeing. Cherry trees are planted throughout the town, so it’s best to wander freely and follow your instincts. You may stumble upon unexpectedly magnificent blossoms tucked away in a quiet back alley.

    You can reach Kawazu directly from the Ito area via the Izu Kyuko Line. However, if you are making the effort, it is highly recommended to head south along National Route 135, which runs along the eastern coast of Izu.

    https://www.strava.com/routes/3461699541618440640

    The distance from Odawara to Kawazu is 84 km. Though it follows the coastline, the route is a continuous series of ups and downs, with a total elevation gain of around 1,000 meters. It may not be an easy ride, but on a clear day you can see Izu Oshima floating in Sagami Bay, as well as the Izu Seven Islands further to the south. The views make the effort worthwhile.

    Another option is a route that crosses Amagi Pass from Shuzenji:

    https://www.strava.com/routes/3461692427489058676

    This route heads south through the heart of the Izu Peninsula and becomes a hill climb over the Amagi Tunnel. The climb from the Shuzenji side is relatively gentle at first. There are two roads—Routes 414 and 349—which eventually merge at Yugashima, a hot spring area. Route 349, with lighter traffic, is recommended. If you wish to stop at the Tsukigase roadside station along the way, simply cross the Kano River to reach Route 414. At this roadside station, you can enjoy light meals such as the Shuzenji Burger (with fried amago trout) and soba noodles—making it a pleasant rest stop.

    After passing Yugashima, the gradient begins to steepen, though it generally stays around 6% and does not become overwhelmingly severe. During the climb, you may want to stop at Joren Falls, a scenic waterfall. However, to see the falls up close, you must descend and climb a considerable number of stairs on foot, so proper walking shoes are essential.

    Further up, you will find the Amagi-goe roadside . From there, it is less than 2 km to the peak at Amagi Tunnel. It may be a good place to take a break.

    Once you pass through the Amagi Tunnel, it is downhill all the way to Kawazu. Be careful, as some sections have gradients of around 10%. As you descend through the mountains, a massive loop-shaped bridge will eventually come into view. Known as the Kawazu Nanadaru Loop Bridge, this double-loop structure eliminates a 45-meter elevation difference in one dramatic sweep—an experience rarely found elsewhere. Kawazu-zakura trees are planted along the inner slopes of the loop.

    Near the loop bridge is an area that provides access to walking trails connecting the seven waterfalls known as Kawazu Nanadaru, and it is also a hot spring district. Izu is famous for its wasabi, and here you will find Wasabi-en Kadoya Shokudo, well known for its “wasabi-don” (rice topped generously with fresh wasabi). It is a popular restaurant, and you may have to wait up to an hour at times, but if you have the time, it is well worth trying—provided you don’t mind the sharp kick of fresh wasabi.

    After passing the loop bridge, the gradient becomes gentler as you gradually approach the town of Kawazu. When you catch sight of the rows of cherry trees lining the Kawazu River, follow the riverside promenade and enjoy the blossoms at your leisure.

  • When the “Toi” Cherry Blossoms Bloom

    January is still winter. That holds true even in Izu, which is considered a relatively warm region. At times, temperatures drop into the single digits, and the mountains of the Amagi Highlands, rising over 1,000 meters above sea level, may be dusted with snow.

    Even in such cold weather, however, there is a type of cherry blossom that heralds the arrival of spring a little early: the Toi-zakura. When people think of cherry blossoms, they usually picture the Somei Yoshino variety, which blooms from late March to early April.

    Yet there are some varieties that reach full bloom even earlier. Among these early bloomers, the Kawazu-zakura is the most famous. True to its name, it blooms in Kawazu on the eastern side of Izu, typically from mid-February to early March. The rows of cherry trees lining the Kawazu River near Kawazu Station are spectacular, and when they reach full bloom, crowds flock there day after day.

    The Toi-zakura blooms about a month earlier than the Kawazu-zakura and is perhaps the earliest-blooming cherry blossom of all. While Kawazu-zakura is well known, it is hard to say the same for Toi-zakura. There are likely several reasons for this. One may be that there is no grand avenue of cherry trees; instead, a few trees stand within temple or shrine grounds, or are scattered here and there throughout the town. The largest cluster can be found at Matsubara Park along Toi Beach and in the surrounding area, but even there, the atmosphere feels modest.

    Another reason may be that Toi itself is not particularly easy to access. By public transportation, one must first travel by train to Shuzenji, then take a bus that runs only about once an hour, and ride it for nearly another hour before finally arriving.

    Moreover, the western side of the Izu Peninsula, where Toi is located, is especially subject to strong westerly winds in winter, with gusts of 7 to 9 meters per second being common. Walking around town to visit the scattered cherry trees in such conditions can be quite challenging.

    All of these factors may contribute to why the Toi-zakura has not become widely known. Nevertheless, from late January to early February each year, the Toi Sakura Festival is held, offering seasonal events unique to this time of year.

    Compared to Somei Yoshino, Toi-zakura blossoms are a deeper pink, with longer stems, and they bloom in a slightly downward-hanging manner. The trees themselves are relatively slender and small, making it possible to step close to branches blooming at about eye level and admire the flowers in detail.

    During the festival period, some temples and shrines offer limited-edition goshuin—special commemorative seals available only at that time. These temples and shrines are scattered throughout Toi and in nearby areas. Since Toi-zakura quietly bloom within their grounds, visiting them while collecting goshuin can be a pleasant way to explore. However, covering the distance on foot can be demanding. The terrain is not particularly steep, so a bicycle is an ideal means of getting around.

    One of the pleasures of cycling in West Izu is riding along coastal roads with Mount Fuji visible in the distance. In particular, the route heading south from Toi toward Cape Lovers (Koibito Misaki) offers views of Mount Fuji from various points along the way.

    In 2026, the blossoms bloomed about two weeks earlier than usual, with some trees reaching full bloom by mid-January. Due to successive cold waves, strong winds blew day after day. It was not until the end of January, when the wind miraculously weakened for just one day, that I was able to visit. Fortunately, many of the blossoms were still in full, vibrant bloom, and I was able to enjoy them at various locations.

    There are several ways to reach Toi:

    1. The coastal route from the Numazu area
      If starting from Numazu, this route is recommended. Along Route 17, you can ride a mostly flat stretch with minimal elevation change along a bay known as Nishiura, heading toward the distinctive cape called Osezaki. Across the bay, Mount Fuji comes into view.

      However, beyond Osezaki, the coastal road features a series of ups and downs. At times, it feels as though you are riding through the mountains. Still, there are many scenic viewpoints along the way, such as Kirameki no Oka, Deai Misaki overlooking the town of Heda, and Ao no Oka with views toward southern Izu.

    1. The climbing route from Shuzenji via the Nishi-Izu Skyline
      From Shuzenji to the entrance of the Nishi-Izu Skyline, there is an elevation gain of about 700 meters. The first few kilometers are quite steep, but after that the climb becomes more gradual. Although Mount Fuji occasionally comes into view, much of the route runs through forested areas. Just before reaching the Skyline, there is a facility called Daruma-yama Rest House, which has an observation deck overlooking Mount Fuji and offers light snacks—an ideal place for a break.

      Even after entering the Nishi-Izu Skyline, the road continues through trees for a while, but gradually the view opens up, revealing distant vistas of Hakone and eastern Izu. Ahead, you will notice a bowl-shaped mountain: Mount Daruma. The Skyline climbs along its mid-slope with a gradient of about 9 percent. During this climb, be sure to look back. On a clear day, Mount Fuji will come into view—one of the finest vistas along the Nishi-Izu Skyline.

      Looking back again while climbing Kokiyama, you can see Mount Fuji beyond Mount Daruma. From there, the road becomes a downhill stretch all the way to Toi, and Mount Fuji disappears behind the mountains, making this the last spot along the way where you can see it.

      At Toi Pass, leave the Skyline and continue downhill toward Toi. You will arrive in less than 30 minutes.
    1. The gently ascending route from Shuzenji via Tsukigase

      Follow Route 349 or 414 along the Kano River toward Tsukigase. From Tsukigase, take Route 136 and continue on a gradual climb. Although this route offers no scenic views, there are no steep slopes, so even those who are not confident in their legs can reach Toi at a relaxed pace. Along the way, you will pass through the Funabara Tunnel, which is over one kilometer long, so be sure to turn on both your front and rear lights. Once through the tunnel, you can enjoy a wonderful downhill ride all the way to Toi.
  • “Izu-Ichi” the  complete loop around the Izu Peninsula

    “Izu-Ichi” refers to a cycling route that makes a complete loop around the Izu Peninsula along the coast. There are several variations, each differing in total distance and elevation gain.

    https://www.strava.com/routes/3162788641041358950

    Much of the Izu Peninsula consists of sheer cliffs that drop straight down to the sea, so even though the route follows the coastline, it is rarely flat. Even the shorter routes exceed 200 km with more than 3,000 m of elevation gain.

    The route I rode was the most demanding of all the variations: a total distance of 270 km with 4,300 m of elevation gain. Starting in Odawara, it circles the peninsula clockwise, crosses the Hakone Pass at an elevation of 846 m, and returns to Odawara.

    Soon after starting in Odawara, the route joins Route 135 along the coast. Repeating short climbs and descents, it heads steadily south. If you depart late at night, you will likely see the sun rise somewhere along the eastern coast of the Izu Peninsula.

    After 100 km from Odawara, you reach the town of Shimoda. From there, there are two options: continue farther south toward Cape Irozaki at the southernmost tip of the peninsula, or take a shortcut across to the west coast. Naturally, the recommended choice is the route to Cape Irozaki.

    Cape Irozaki is one of the few places in Minami-Izu with shops and vending machines, making it an ideal spot for rest and resupply. Reaching the Irozaki Lighthouse requires a short walk of a few minutes, but the view from there is magnificent, so it is well worth visiting if time allows. Be aware, however, that the area around Cape Irozaki is not accessible 24 hours a day, so be sure to check opening hours in advance.

    Leaving Cape Irozaki and heading toward West Izu, there are spots where you can look out over sheer cliffs and emerald-blue, crystal-clear seas. Enjoy these views as you ride on.

    After that, the route briefly leaves the coast, passing through a series of tunnels and a short climbing section. Following a descent, the road gently climbs through open rice fields before passing another tunnel—this marks the beginning of the West Izu section. At this point, you have covered about 130 km from Odawara, roughly half the total distance, but the accumulated elevation gain is still only around 1,800 m, not yet half of the total.

    After the tunnel, a winding downhill brings the sea back into view. Passing quiet fishing villages, the climbing begins again. For a while, the route is a continuous series of ups and downs, with gradients reaching around 10% as you climb to elevations of several hundred meters. The sea disappears once more as the road winds through the mountains with repeated climbs and descents. Eventually, you reach a summit area with a few buildings—some may be cafés. From the parking area across the road, you can look out over the sea of West Izu: Suruga Bay.

    After that come more descents, gentle climbs, and then a longer downhill. Soon you will see a sign indicating entry into Matsuzaki Town. Farther on, the road splits to the right, but you can continue straight on the main route. If you do turn right and climb a short distance, however, you will reach an observation point overlooking the Ishibu Rice Terraces, a distinctive landscape of small, table-like rice paddies layered across a steep slope.

    The downhill eventually leads to the area of Kumomi, a quiet fishing port surrounded by cliffs. On a clear day, Mount Fuji can be seen from here. The stretch from Kumomi to Matsuzaki is, in my opinion, the most beautiful section of the Izu Peninsula. The road is carved into seaside cliffs, twisting along the rock face with repeated climbs and descents.

    Eventually, the townscape of Matsuzaki comes into view, followed by a downhill ride into town.

    Matsuzaki is a beautiful town. Many old houses remain, featuring “namako walls”—grid-patterned plaster walls—creating a calm, rural atmosphere entirely different from that of a big city. Time seems to flow gently here, and it is easy to linger longer than planned. If you have time, take a walk around town. Depending on the season, you may see flower fields planted in rice paddies before planting season, or, in spring, cherry blossom trees lining the river for several kilometers. This is why Matsuzaki is known as the “Town of Flowers and Romance.”

    Leaving Matsuzaki, the route heads north and soon reaches Dogashima, an area full of attractions and also popular for its hot spring inns.

    Beyond Dogashima, the road passes through a series of tunnels, with little view of the sea, making this a somewhat monotonous section. Given the mountainous nature of the Izu Peninsula, this is unavoidable—there is no other route that stays closer to the coastline throughout.

    Eventually, you will see signs for a scenic spot called Koganezaki, marking the town of Ugusu. Ugusu is very small and passes by quickly, but nearby Koganezaki offers a rare view: steep cliff faces that glow golden in the setting sun. Even outside sunset hours, the yellowish rock can appear golden depending on the light. Ugusu is also the starting point for the climbing route up Nishina Pass.

    The stretch from Ugusu to Toi is one of the gentler sections in West Izu, with relatively relaxed ups and downs. The peak of this section is a viewpoint known as Lover’s Cape, after which the road gradually descends. On a clear day, you can ride with Mount Fuji in view ahead.

    Soon you arrive in Toi, a town famous for the Toi Gold Mine and its many hot spring inns—perhaps the most prominent tourist destination in West Izu. After passing through Toi, the route leaves the coast slightly and a climbing section begins, with two ascents of several hundred meters each. There is an observation deck along the way. The road narrows, houses become scarce, and after a series of hairpin turns on the descent, you may spot a uniquely shaped cape below—that is the town of Heda.

    Heda is a quiet town nestled between mountains and protected by a sandbar, and it marks the starting point of the steep Heda Pass. However, since Izu-Ichi follows the coast, it does not head toward Heda Pass. Leaving Heda toward Cape Osezaki, the road quickly steepens to around a 10% gradient, climbing more than 100 meters in one go. There is an observation point just before the peak where you can look down over Heda—an ideal place for a short break. After another climb of similar intensity and a tunnel, the harsh ups and downs of the Izu Peninsula finally come to an end. A downhill follows, and soon you will see a cape reminiscent of Heda—this is Osezaki. Across the sea, Mount Fuji may also come into view.

    From there, ride on with Mount Fuji and the sea to your left, descending to a road close to sea level. For a while, there are no significant climbs.

    As the coastal road turns toward central Numazu, you bid farewell to the sea. Suddenly, you are thrown into urban traffic, stopping at signals and watching for an unbroken flow of cars as you head toward Hakone Pass—the final peak and the last major challenge of Izu-Ichi. This is the first sustained climb to around 800 m elevation on the route. Looking at the elevation profile on Strava, Hakone Pass clearly stands out. Still, do not forget that by this point you have already accumulated around 3,500 m of climbing—the Izu Peninsula is demanding even along its coast.

    You will climb National Route 1 steadily. The gradient averages around 6%, so it is not excessively steep, but the climb is over 10 km long and may feel punishing to an already exhausted body and mind. Along the way, there is a signal where the road branches toward the Nakayama Castle Ruins. Cyclists are recommended to take this route, as there are vending machines at the ruins where you can rest and resupply.

    After passing the ruins, you soon rejoin Route 1. There are no traffic lights here, so be sure to check carefully for cars before merging into the uphill lane. Though it may feel as if the climb will never end, the mountain ridge will gradually draw closer. When you see buildings and parking areas that look like facilities of some sort, the signal at Hakone Pass is just ahead—the end of this grueling journey is near.

    From Hakone Pass, descend toward Lake Ashinoko. Continue on, then climb briefly again from the town of Motohakone—this lasts only a few minutes. At the next signal, you must choose to turn left or right. Turning right leads to a steep downhill on a lightly trafficked road, while turning left means climbing a bit more before descending on a route with gentler gradients but heavier traffic and possible congestion.

    Either way, once you begin descending, it is almost all downhill to Odawara. Prioritize safety and take it easy, especially through hot spring areas where there may be many pedestrians depending on the time of day.

    When the winding road finally straightens, that is your victory run into Odawara. Savor the final pedal strokes as you feel the long adventure coming to an end.

  • Heda Pass

    Heda is a small fishing port, flanked by steep mountains on both sides, with a long, narrow sandspit lined with pine trees stretching out into the sea.

    From there, a road climbs steeply up to the starting point of the Nishi-Izu Skyline, a route that runs north to south at around 800 meters above sea level.

    Starting from Heda Port, the road reaches Heda Pass at about 700 meters in elevation after roughly 10 kilometers. This gives an average gradient of 7%. But an average is only an average—the nature of the climb changes dramatically between the first and second halves. In that sense, it is similar in structure to the climb to Nishina Pass. Compared by distance, Heda Pass is more compact, but in terms of severity it is no less unforgiving. After a gentle 200-meter gain over the first 4.6 kilometers, the road climbs another 540 meters in the remaining 5.4 kilometers. That means an average gradient of 10% in the second half. In reality, it holds closer to a relentless 12%, with only occasional stretches that ease off to 7–8%, but it never gets any gentler than that.

    Less than a kilometer from the start in Heda town, you’ll reach Michi-no-Eki Kurura. In addition to selling local products, it offers a footbath and even a public hot spring, making it a great place to stop and relax if time allows.
    https://kururaheda.net/

    Beyond Kurura, houses grow sparse, the mountains close in, and the road narrows into a valley. Following the Ōkawa River on the left, the road curves sharply across the stream and the gradient begins to bite. After a few bends, the slope steepens further, demanding more strength from your legs—this is where Heda Pass truly begins. The 10% ramps continue without respite, and when you glance upward, you can see the road snaking toward the high ridges above you.

    Keep grinding and you’ll eventually reach a fork where you must continue straight. The slope remains merciless, often hitting 12%, and never offering the kindness of a 5% grade.

    Yet as the altitude increases, the views begin to open up. You’ll see the ridgelines of the Nishi-Izu mountains, or the valley you’ve just climbed out of spread below. The road clings to the steep slopes, winding back and forth as it gains elevation. When Suruga Bay, hidden until now by the mountains, finally comes into view, you’ll know the pass is only about a kilometer away. The sky feels closer, and to the right you can see the faraway ridges of western Izu as you battle the last brutal ramps. The pass itself is a cut in the ridge, but a large parking area just before it can serve as a finishing point—it’s as good as summiting. From there, the town of Heda is hidden by the mountains in front, but you can look out over Suruga Bay and across the Shizuoka plain beyond.

    After catching your breath, you may descend toward Shuzenji.

    Or continue climbing onto the Nishi-Izu Skyline, where even higher elevations and magnificent views await.

    The joy beyond the pain is a supreme reward granted only to those who conquer the climb.

    STRAVA root : https://www.strava.com/routes/3408006470790831326

  • Nishina Pass

    The route with the most merciless slope in the Izu Peninsula is from this Ugusu.

    From Ugusu, a small town by the sea, you start running towards the Amagi Plateau in front of you, and it is a gentle riverside road for a while.

    Eventually, when the houses were cut off and you entered the mountainous area surrounded by trees, the road became as narrow as a car, and the slope was around 10%.

    This is where this route is in production. A merciless slope with an average slope of 9% that climbs about 840m in about 9 km is waiting.

    There are two flat sections of about a few hundred meters in the middle, so you can take a break there, but there are places where it is instantaneous to 30% in the inside of the slope or curve of about 15%.

    If the altitude rises and you start to see the town and sea of Ugusu, the starting point from the mountainous area, you will be a little closer to the Amagi Kogen Ranch.

    There is a rest house on the ranch where you can enjoy snacks, so you can stop by.

    Sometimes cows are released on the ranch depending on the season.

    The road extends to the left at the end of the straight climb that runs through such a ranch. If you turn around, you will see the scenery full of openness overlooking Suruga Bay.

    It’s a little bit to the pass. The slope of nearly 10% continues until the end, but in the majestic scenery without trees blocking it, when you climb the ridge road, you feel that your legs, which should have been tired, will return to your strength.

    The sign of Nishina Pass is the goal. There is a stone monument on the side of the road. The ranch is close, so there is also a sign that says “Beware of cows”.

    From the pass, you can see Suruga Bay, and on a sunny day, you can see Mt. Fuji in the distance.

    If you get off your bike and climb the hiking trail a little, you can go to the top of the mountain.