
Building a Long-Ride Prediction Tool with AI, Part 2
In the previous post, I wrote about why I wanted to build a personal long-ride prediction tool: I wanted to know what time I needed to leave in order to get home before sunset.
Strava tells me the distance and elevation gain, but it does not really tell me how long a route will take when I ride it, including breaks, traffic lights, and the fatigue that builds up later in the day. So I wondered whether I could make a prediction that better reflected my own riding by using my past ride data.
This time, I begin the actual prototyping process with help from ChatGPT.
The plan was to analyze my past rides, predict the time required for a GPX route made in Strava, and create things such as a nutrition plan and a stem sheet. As I kept experimenting, however, analysis scripts and data files began multiplying one after another, until the whole thing gradually became difficult to control.
First, I Just Wanted a Predicted Moving Time
The first thing I wanted was simple: load a route made in Strava and estimate how long it would take me to ride it.
A GPX file exported from Strava contains information such as route position and elevation. That may be obvious to people who know this subject, but I did not even really know what was inside a GPX file.
So I asked ChatGPT: “I want to read distance and gradient from a Strava GPX file and predict the time using my past ride data.”
It gave me a Python script for reading the GPX file.
I placed the files where I was told and ran the script. A CSV file appeared, filled with numbers for distance, gradient, predicted speed, and arrival time.
Oh. Something came out.
At that point, I had no idea whether the prediction was correct. Still, I was slightly moved that someone who could not write a program had followed the instructions and produced numbers that looked plausible.
Predicting from Speed at Different Gradients
The basic prediction model came from my speed at different gradients in past ride logs.
How fast do I ride on flat roads? How much do I slow down on gentle climbs? What happens above 5%? How fast do I descend?
By analyzing past ride logs, it should be possible to see roughly how fast I tend to ride at each gradient.
The idea was to divide a new route into small segments, apply my predicted speed for each gradient, and then add everything together to calculate the total moving time.
Real speed is also affected by road surface, traffic, signals, and wind. Even so, using my own past data rather than a general average seemed likely to produce a prediction that was at least closer to me.
We therefore made a script that analyzed the relationship between gradient and speed in my past data and used it to predict a GPX route.

At Least It Produced Some Numbers
When I tried loading my complete-loop route around the Izu Peninsula, the result looked like this:
Route: 260508_Izu-Ichi.gpx
Route points: 47447
Distance: 274.1 km
Predicted moving time: 13.27 h
Predicted avg speed: 20.7 km/h
For 274.1 km, the predicted moving time was 13.27 hours and the predicted average speed was 20.7 km/h.
The numbers looked believable.
It was much more concrete than staring at the distance and elevation gain and trying to estimate everything in my head. At the very least, it gave me a broad sense of whether a route would be extremely slow or reasonably rideable.
But this was only moving time. It did not include waiting at signals, convenience-store stops, meal breaks, or time spent stopping for photographs.
What I really wanted was the total elapsed time from departure to return. A ride might start and finish at home, or at a station reached by train, but a moving time of 13 hours does not mean I will be back 13 hours after leaving.
So how many hours would it take including breaks?
This is where the story became more complicated.
Are Break Times Predictions or Suggestions?
Break time on a long ride varies greatly depending on the day.
Buying a drink at a convenience store may take only a few minutes, while a meal takes longer. On a hot day I may want to rest in the shade. If the view is good, I will want photographs. Sometimes I find a cafe and get drawn inside for no particular reason.
Accurately predicting break time is therefore quite difficult.
We began to think that instead of predicting breaks, it might be more realistic to define a break pattern in advance and use it to calculate total elapsed time.
For example, take a ten-minute break every hour, take a short break every two hours and a longer one every four hours, or suggest stopping near a convenience store or before a long climb.
I would not have to follow the plan exactly during the ride. But placing a break plan on top of moving time would make it possible to estimate total elapsed time.
Just when producing a predicted time felt like progress, a new problem appeared: how should breaks be handled?
If I Am Doing This, I Want a Nutrition Plan Too
Once I started thinking about breaks, nutrition naturally became important too.
On a ride longer than ten hours, where and what to eat matters greatly. If delayed nutrition causes a major collapse later, the prediction for getting home before sunset becomes meaningless.
At first, I thought hourly predicted locations would be enough. But if the tool could calculate a location for every hour, perhaps it could also show a nutrition target there.
How many calories should I consume each hour? Should I eat before a long climb? Before entering a long section without convenience stores, how much water and food should I buy?
If the tool could show those things, it would become a usable ride plan rather than only a time-prediction table.
So I began making a nutrition plan too.

In addition to the prediction CSV, the outputs gradually expanded to include a nutrition plan, heart-rate analysis, gradient-versus-heart-rate analysis, a stem-sheet PDF, graphs, and tables.
Whenever I thought of something and asked, “Can it output this too?”, ChatGPT usually made something.
I got carried away by how convenient it was, and the situation gradually became troublesome.
The Analysis Scripts Begin to Multiply
When building something through conversation with AI, each new request tends to produce a new script.
One reads GPX files. One creates a gradient-based speed model. One creates a nutrition plan. Others make PDFs, graphs, or charts.
At first, each script looks useful because it has a clear role.
After repeated revisions, though, I gradually stopped understanding what I had.
Which script was I currently using? Was this the old one or the revised one? Which script produced this CSV? What settings were used when this PDF was created?
I saved every new script ChatGPT gave me, but I had no system for knowing which one was now correct.
Sometimes a requested revision even seemed to return to something made much earlier.
In the chat, I actually said, “It feels like we may have gone back to something made quite a while ago.”
I was completely lost.

This was less a problem with AI than a result of my own lack of development and project-management knowledge. I was simply saving whatever appeared and moving forward.
Someone accustomed to development would organize the purpose of each file, manage change history, and make it clear which version was current. I was fully occupied just pasting the code I was given and running it.
The number of useful things was increasing, while the overall picture was becoming harder and harder to see.
It Does Not Fit on the Stem Sheet
There were also problems on the output side.
As I added more information to the stem sheet, I naturally ran out of space.
The size that can be taped to a bicycle stem is limited. I tried to include hourly distance, estimated arrival time, nutrition, convenience-store availability, and route type. In the first table, the text overlapped.
“Fuel” extended outside its column. Words overlapped and became unreadable. Something that looked fine at a large size on screen became useless when reduced to stem-sheet size.

So I began shortening the displayed words.
Mountain became M, convenience store became CVS, water became WTR, gel became GEL, and onigiri became ONI.
This is how the stem sheet filled with mysterious symbols from the previous post was born.
M350, ONI+GEL/WTR, CVS NO.

It may look like a code to anyone else, but it works for me. During a ride, short symbols are easier to read than long explanations.
This process also taught me that adding more information does not always make something more useful. In a limited space, deciding what not to include is just as important as deciding what to add.
“Unable to Display Visualization”
During prototyping, I repeatedly encountered displays that I did not understand.
“Unable to display visualization.”
ChatGPT seemed to have created a graph or table, but I could not display it. Sometimes nothing appeared at all, even though the process seemed to finish. At one point, mysterious text such as “403r” appeared on screen, leading to another conversation about what it could possibly mean.
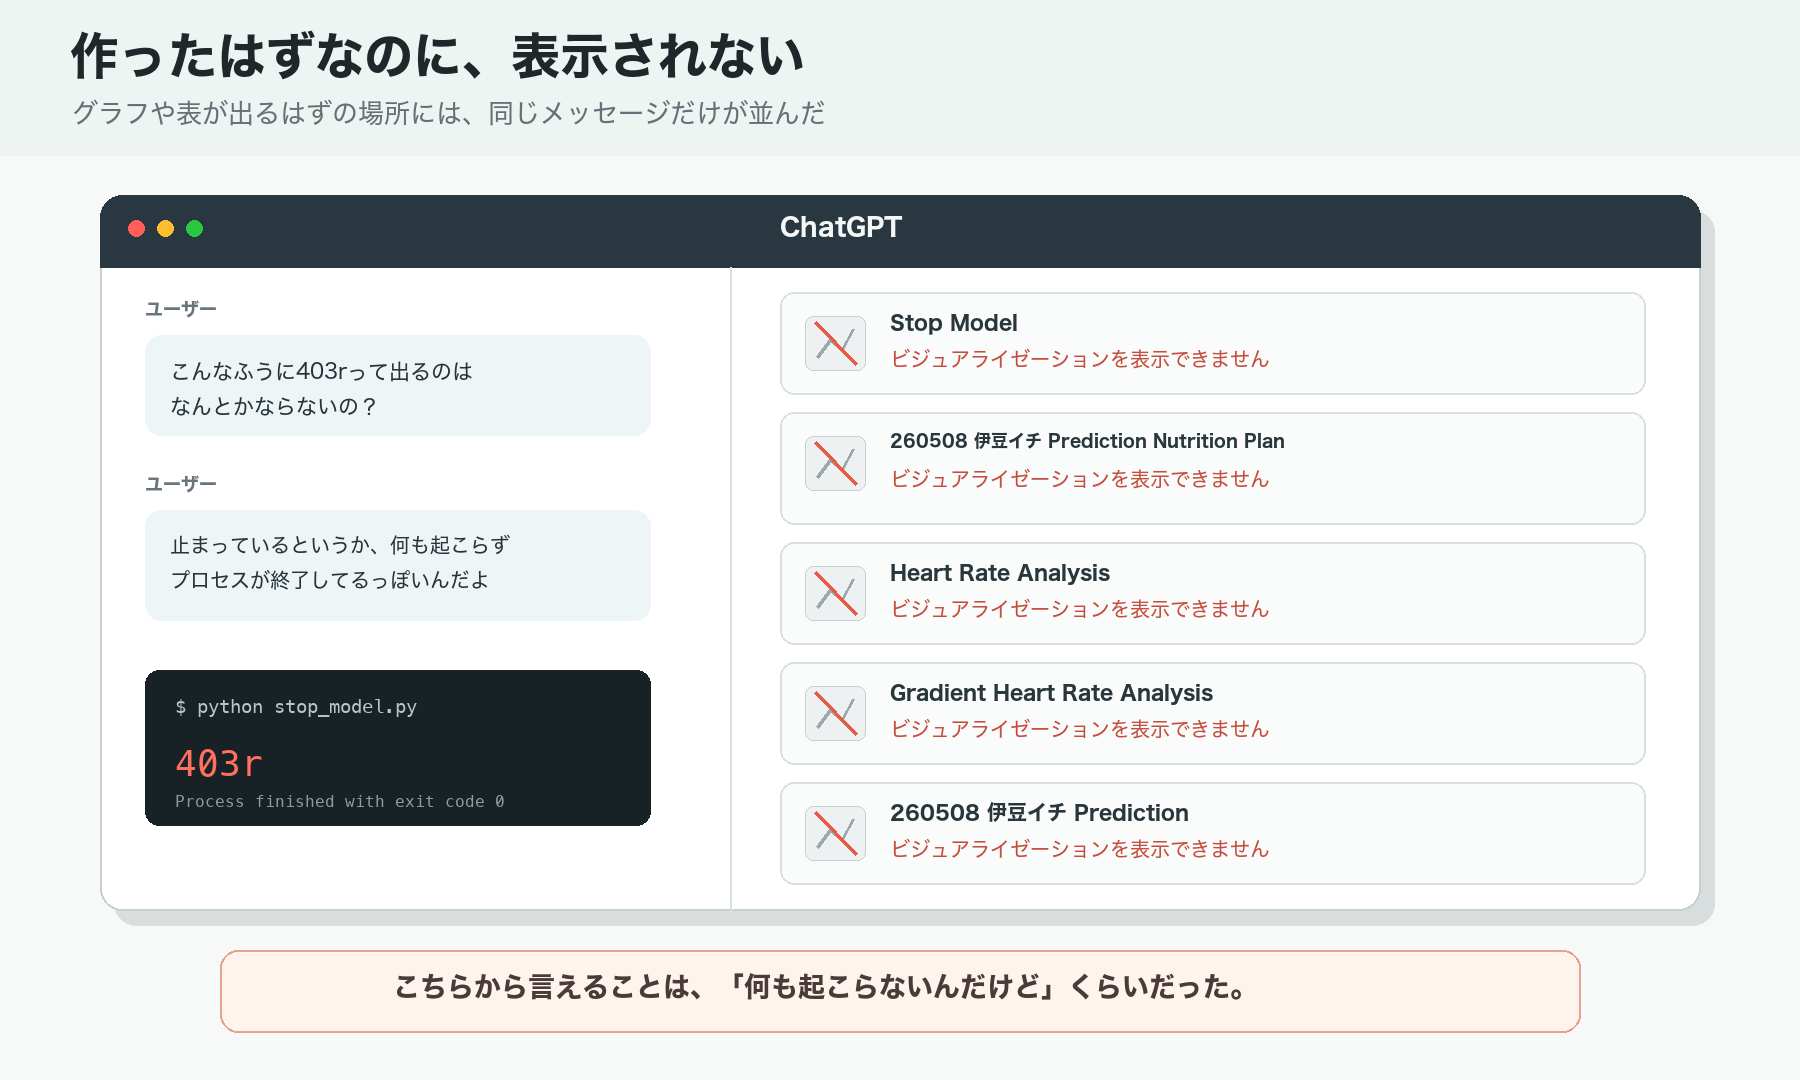
Someone familiar with programming would probably read logs and isolate the cause. About all I could say was, “Nothing happened.”
I described the screen and displayed text to ChatGPT, pasted output when necessary, received a correction, and tried again.
It moved a little, broke a little, I asked again, and we fixed it again. That was the repeated process.
It was not like asking AI and receiving a magically complete result in one attempt. The process was quite messy, but this is probably what it actually looks like when a beginner tries to build something with help from AI.
Still, It Gradually Takes Shape
The files increased. The outputs increased. Sometimes I no longer knew which version was current.
Even so, the project gradually moved closer to what I had originally wanted.
Loading a GPX file produced a predicted moving time from distance and gradient. My speed at different gradients could be applied from past ride data. The tool began producing total elapsed time including breaks, rough nutrition guidance, hourly locations, and something that could be printed as a stem sheet.
I still could not write the code myself or understand every part of the system. But by repeatedly explaining what I wanted, looking at the result, and asking for changes, it gradually took shape.
It was a very interesting experience.
At the same time, it became clear that if I continued adding features without organizing anything, the project would eventually collapse completely.
Time to Organize Everything
In the chat, I said: “There are too many scripts and too much data appearing, and everything is getting mixed together. Let’s stop and organize it.”
That was exactly right.
Keep what is necessary and remove the rest. Clarify what each script does. Separate input files from output files. Turn the final workflow into a single clear path.

By this point, continuing the prototype only through conversation with ChatGPT was becoming difficult.
Receiving code in the chat, running it locally, pasting the result, and asking for corrections could still move the project forward. But as files multiplied and several functions began to depend on one another, management became increasingly difficult.
I also wanted a simple application where selecting a route would generate the necessary outputs together, instead of running each script separately. At that point, I began to feel the limits of working only through chat.
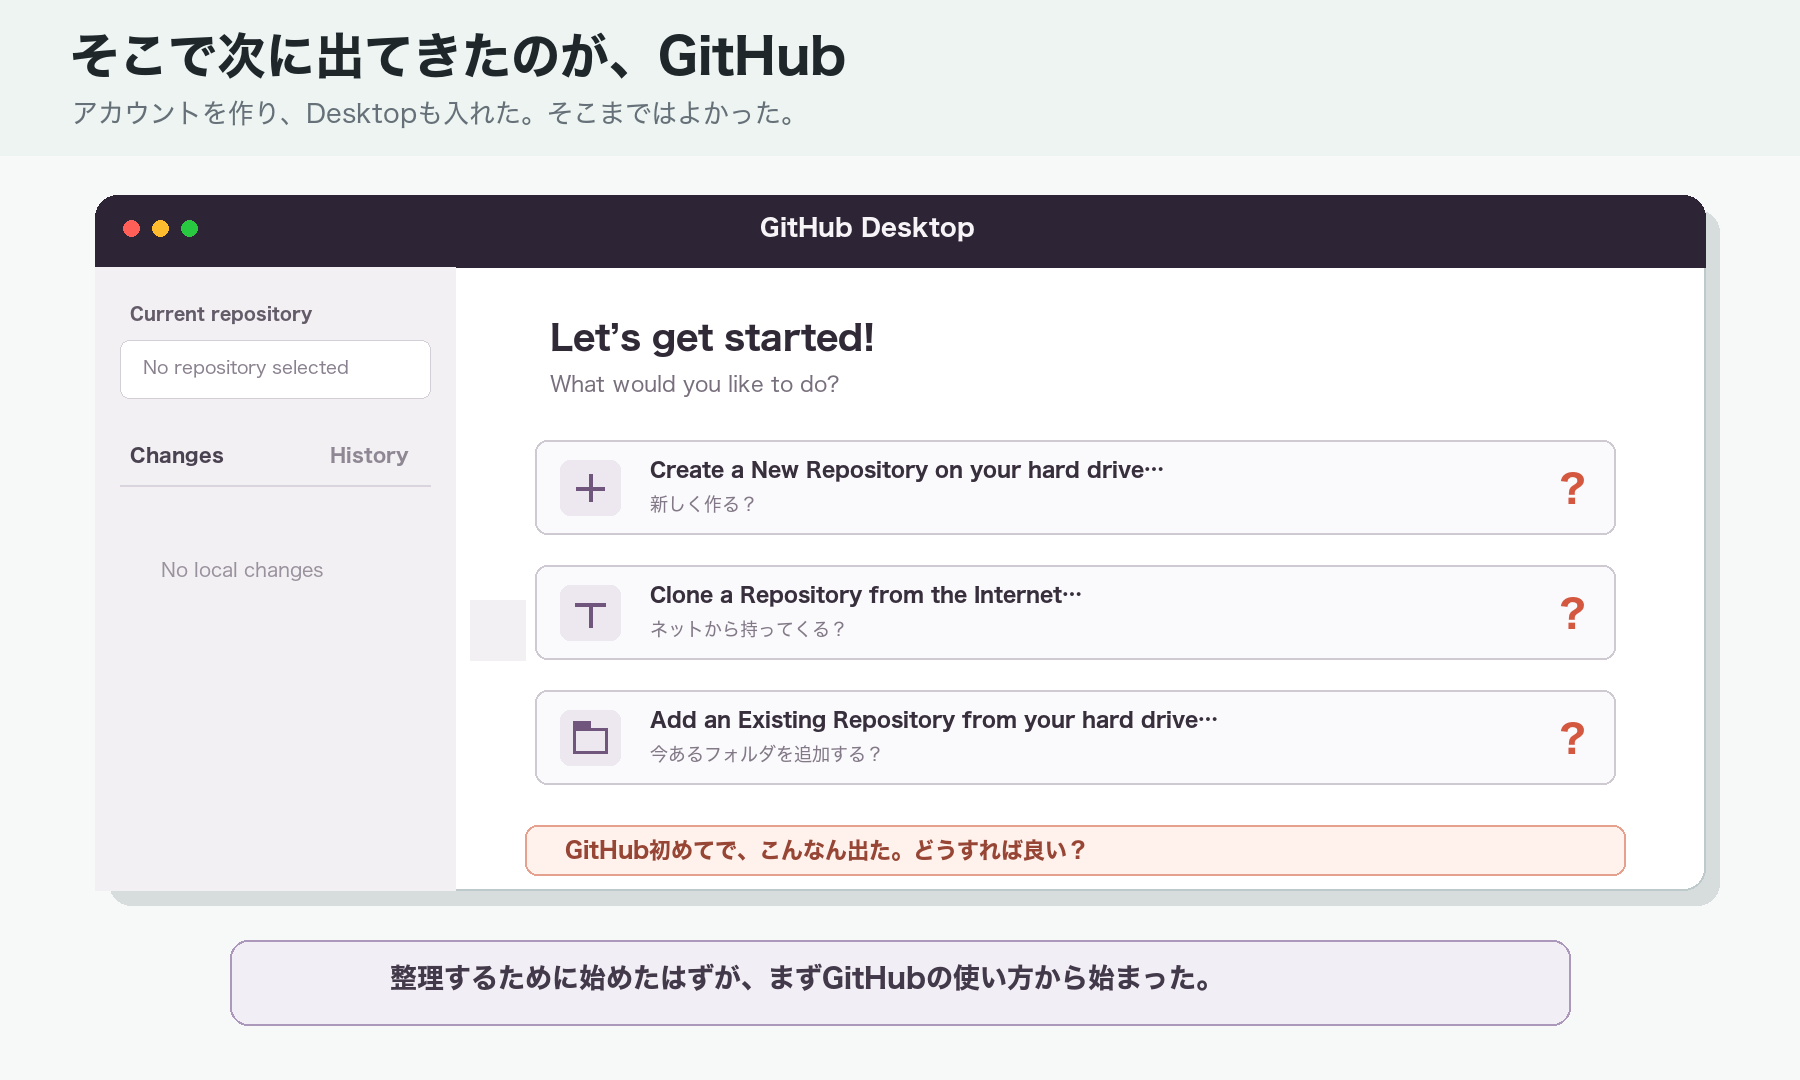
That is where GitHub entered the story.
But GitHub was new to me too. I created an account and installed GitHub Desktop, and naturally found myself looking at another screen I did not understand.
What was I supposed to do now?
Next time, I will write about organizing the prototype created with ChatGPT, shaping it into a simple application, and moving toward development with Codex.
This is where the story finally begins to shift from “making a prediction table” toward “making a tool that can actually be used.”
Leave a Reply